Shiba Inu is strongly bullish but sellers can look for scalping opportunities soon

Disclaimer: The information presented does not constitute financial, investment, trading, or other types of advice and is solely the writer’s opinion.
- The market structure was firmly bullish.
- The price headed into a cloud of resistance, which meant a pullback could occur.
Bitcoin hovered about the $23.4k mark at press time. The $24.5k-$25k area has offered stern resistance to BTC since mid-August. To the south, the $21.6k area can see some demand. Shiba Inu has pumped alongside BTC’s gains.
Read Shiba Inu’s Price Prediction 2023-24
Since December 30, Shiba Inu has registered gains of close to 100%. It approached a resistance level from early November. A breakout and a rejection are both possibilities. The direction of BTC could decide SHIB’s next move as well.
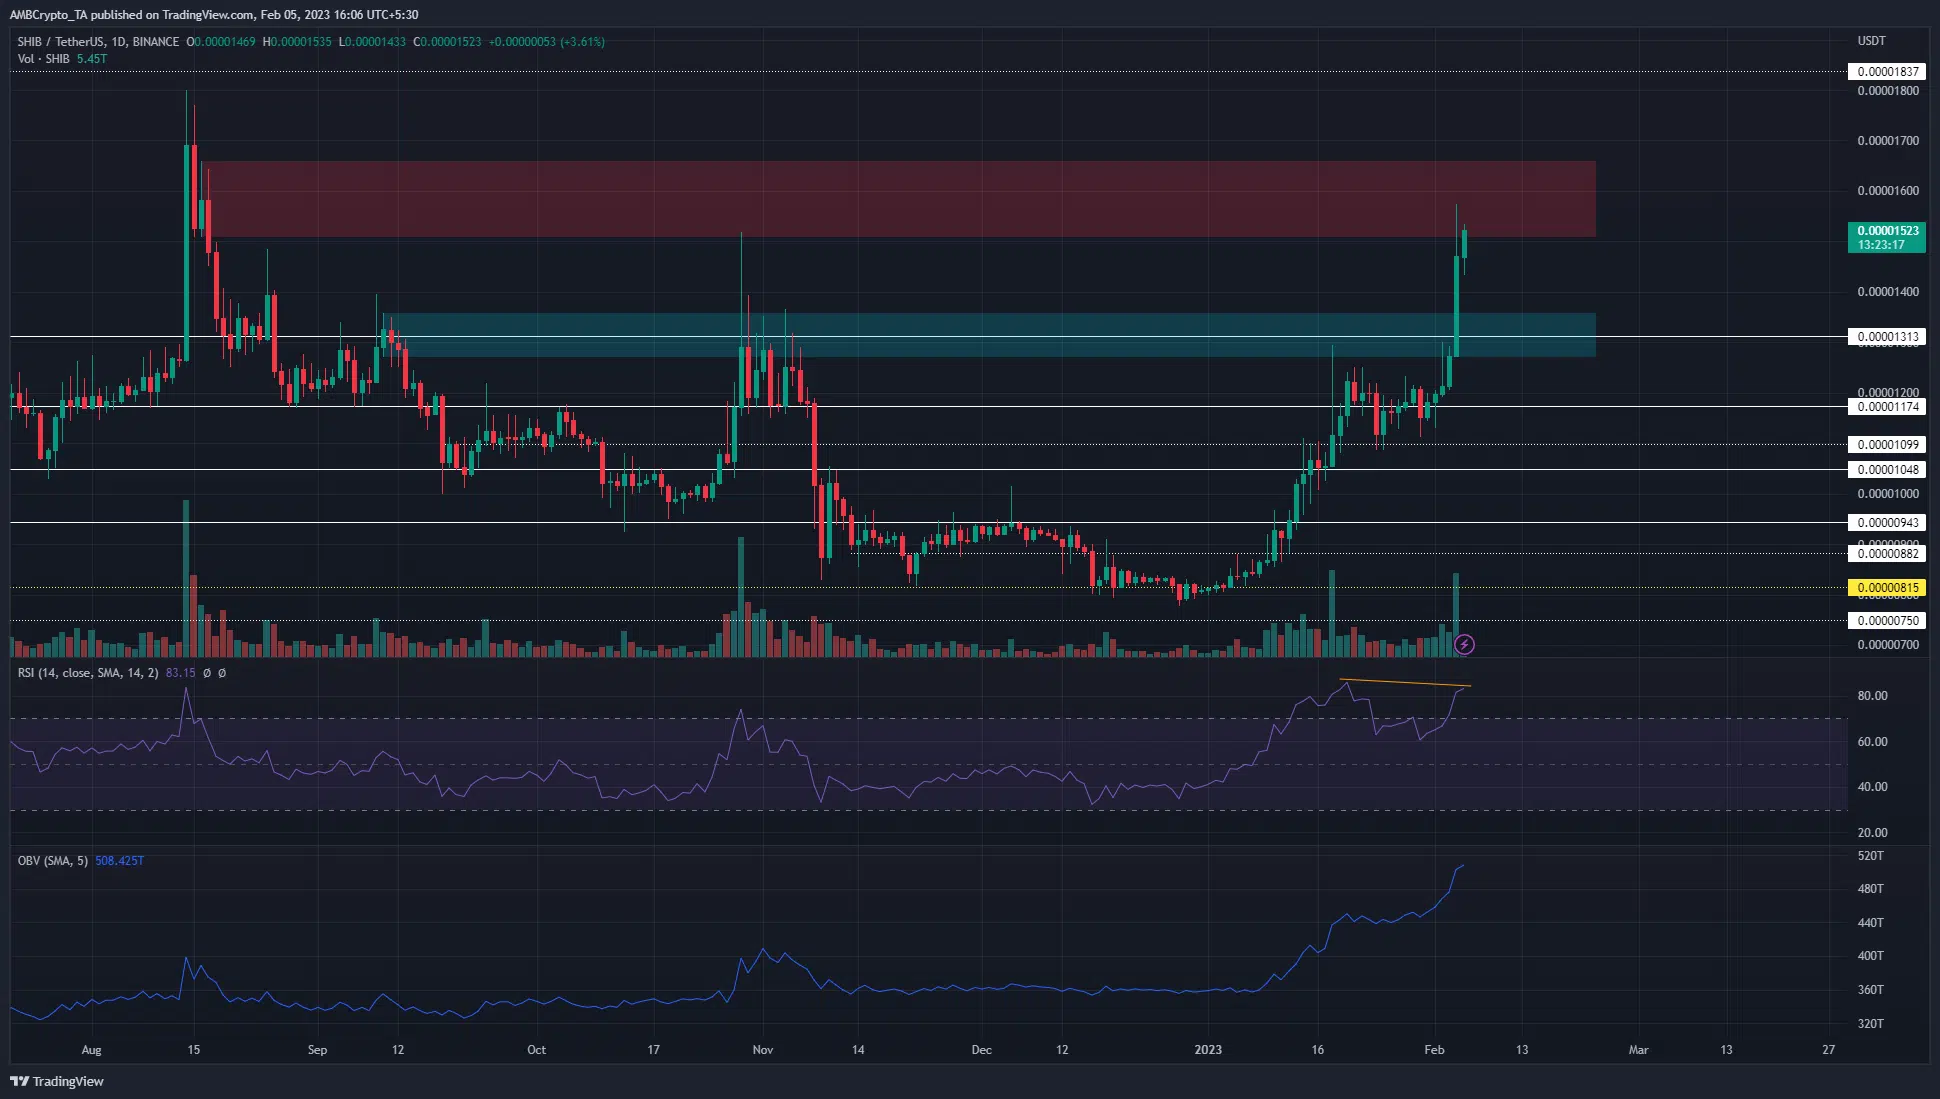
The bearish order block at $0.000013 was beaten convincingly and SHIB rushes to the next resistance at $0.000016
A bearish order block was marked in cyan at the $0.000013 area. However, the past few days of trading saw SHIB shoot upward past this resistance. Therefore, a retest of this area would be a buying opportunity, as it would be a bullish breaker at a significant horizontal level.
Another order block was seen to the north at $0.000016. The $0.0000173 and $0.0000182 levels are also ones to watch out for. Since SHIB has already reached this area of resistance, a lower timeframe flip in structure could precede a sharp pullback toward $0.000013.
Is your portfolio green? Check the Shiba Inu Profit Calculator
The $0.0000143 level was the higher low in the 1-hour timeframe. A move beneath this level flip the lower timeframe structure to bearish.
While aggressive traders can use this move to enter scalp short positions, more risk-averse traders can wait for a move into the $0.000013 area to enter long positions.
Conversely, a move to $0.0000173-$0.0000182 levels can offer a selling opportunity after a bearish structure break and retest.
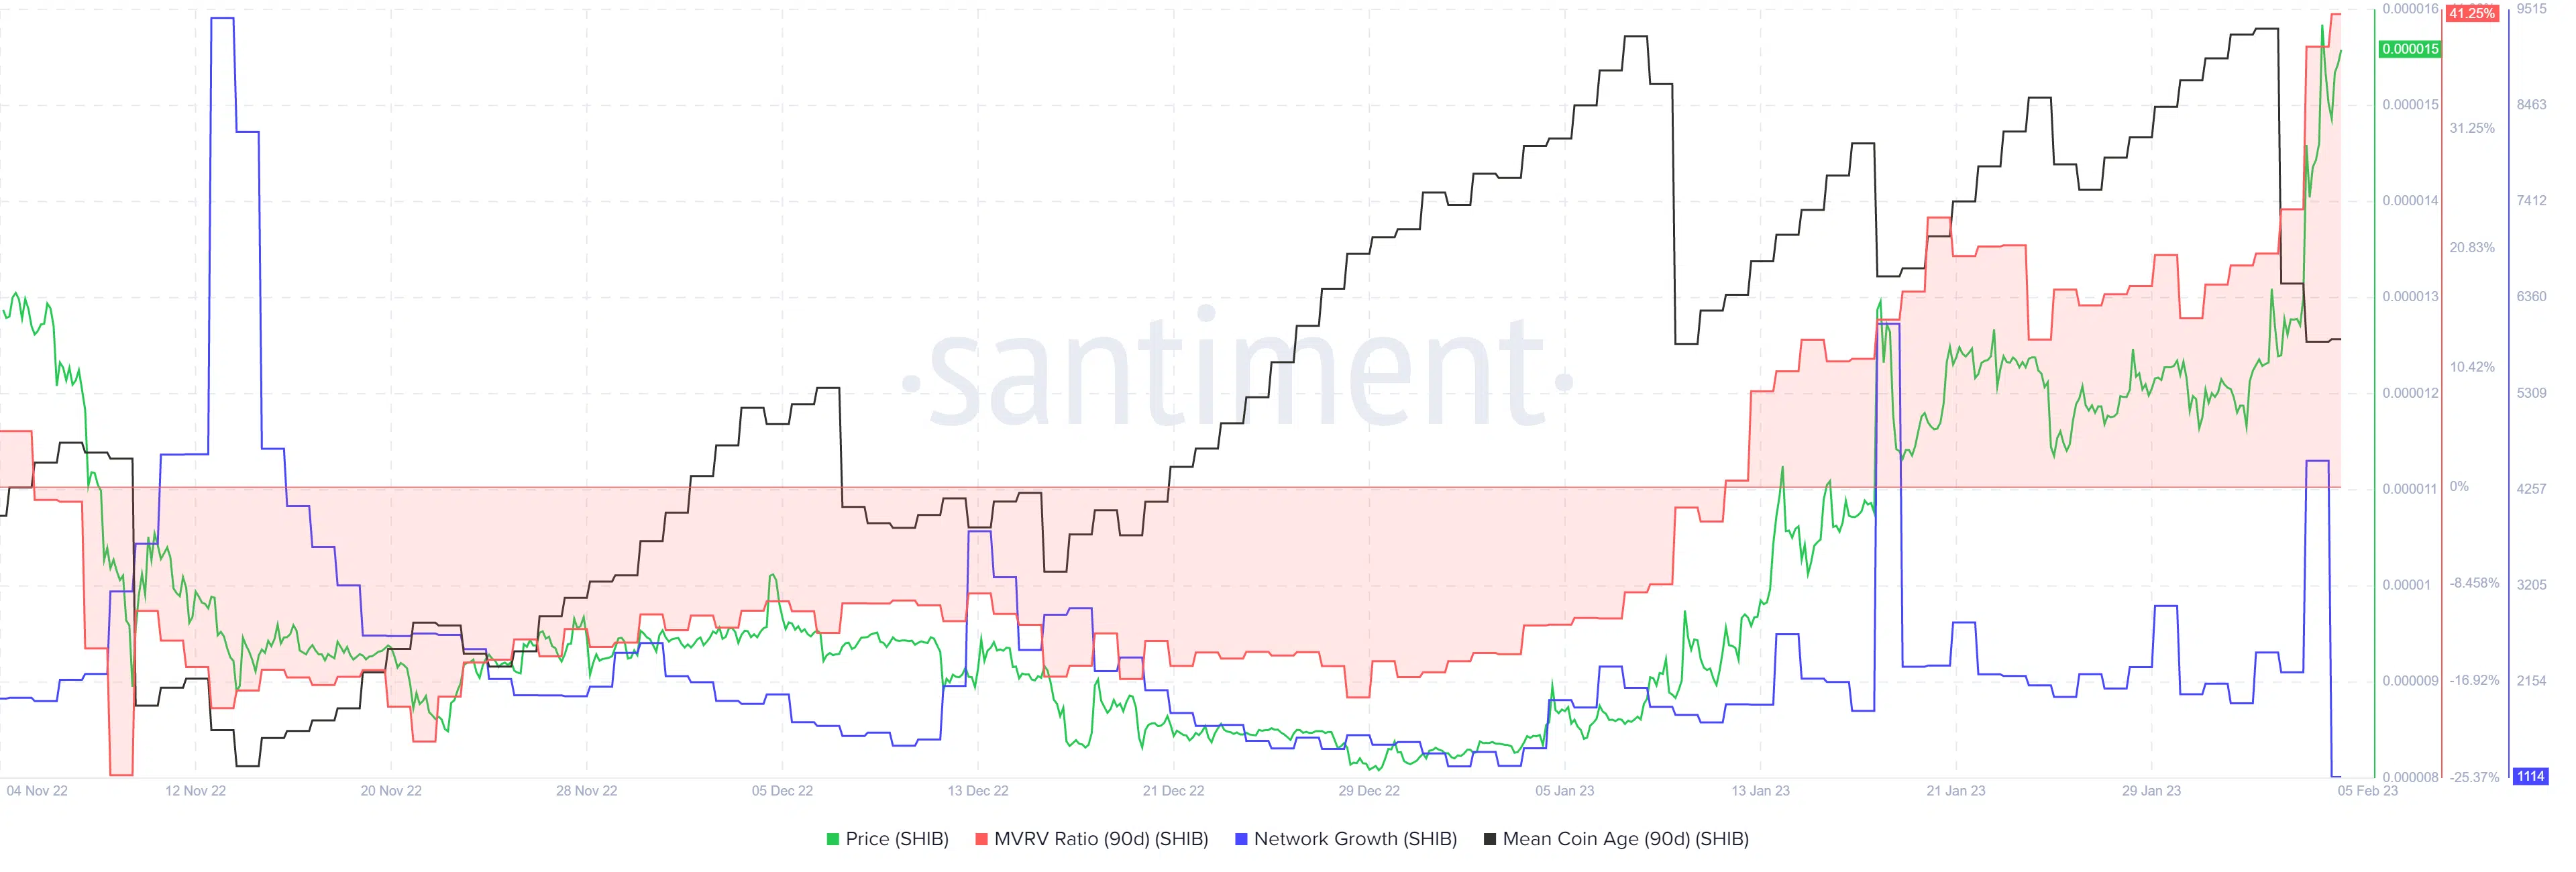
3-month high on the MVRV ratio meant it was time for bulls to be cautious

Source: Santiment
The network growth metric has seen some spikes in the past month, notably on January 18 and February 4. Meanwhile, the mean coin age (90-day) has oscillated since early January.
This meant that there has been large amounts of the coin moved, and an accumulation trend like the one in late December was not witnessed.
But the more worrisome metric was the 30-day MVRV, which hit a 3-month high. This was not good, especially in a bear market, as short-term holders are more likely to be looking to sell their holdings for a profit.


