Binance Chain registers a 229% surge in this metric- Are investors happy about it?

- Binance Chain’s daily transactions recorded a year-to-date growth of 229%.
- The network’s NFT trading volume declined sharply in February.
Binance Chain [BNB] recorded a big jump in its daily transaction volume over the week, rising from 3.5 million to over 5 million at the time of writing.
While this amounted to a nearly 47% rise, a closer look at the data revealed that the chain’s year-to-date (YTD) growth was also impressive. BNB chain’s total transactions have more than doubled since the start of 2023.
Something is happening on BSC. Daily transactions are suddenly up from 3.5M earlier this week to over 5M today. pic.twitter.com/b7GVzkjD9u
— Patrick Scott (@patfscott) March 3, 2023
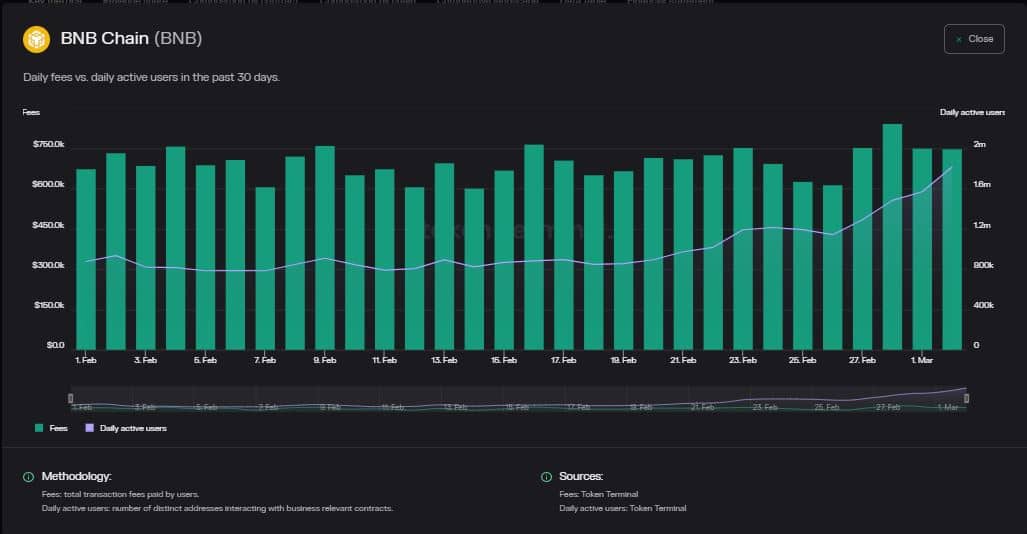
Furthermore, the Binance chain registered a 50% growth in its daily active users (DAUs) since the start of the week, according to Token Terminal.
Due to the increase in the number of DAUs, the protocol’s transaction fees also expanded by 21% in the same time period.
Read Binance Coin’s [BNB] Price Prediction 2023-24
It’s a flop show on DeFi, NFT front!
The growth in network adoption could be due to some big-ticket launches in its NFT vertical. On 1 March, a platform named Bicassso was unveiled by Binance, which would combine artificial intelligence (AI) and non-fungible token (NFT) technology.
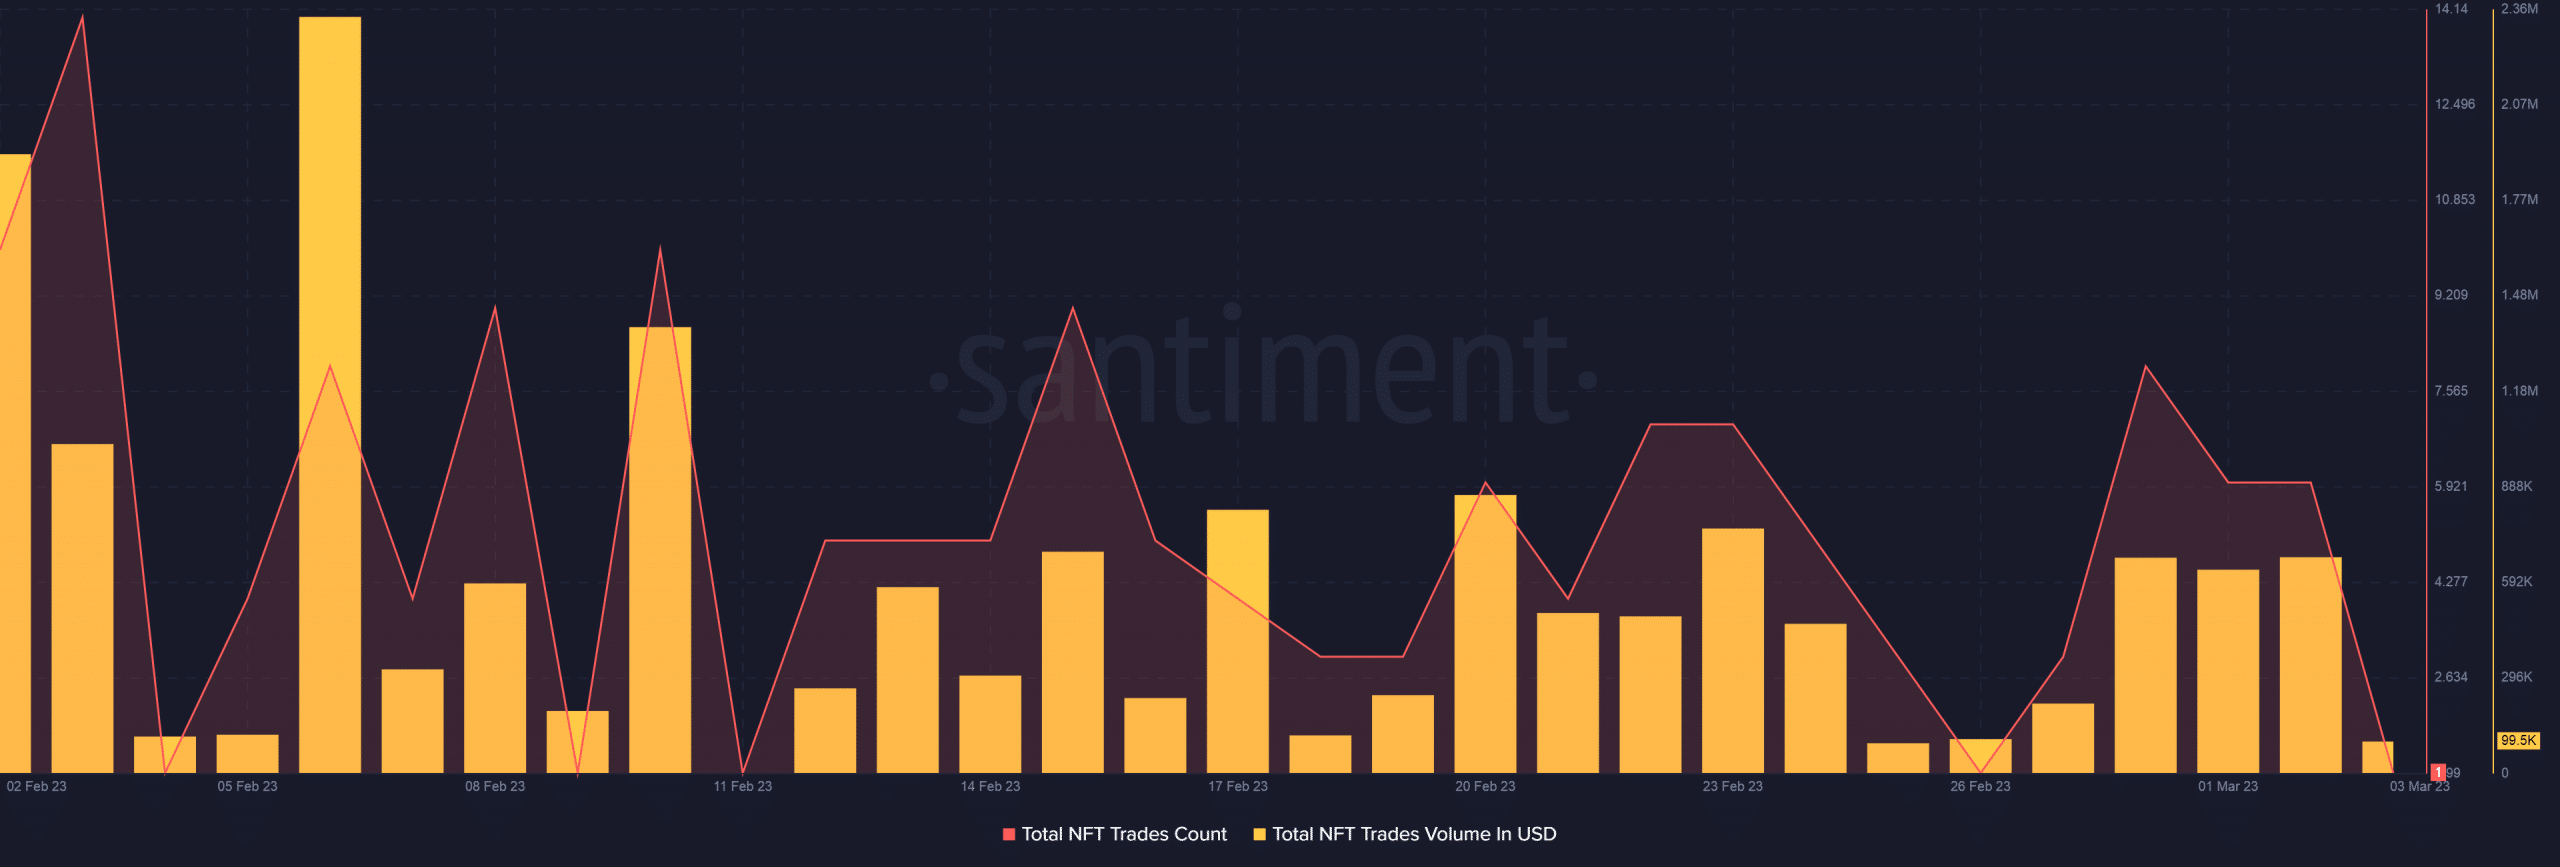
However, data from Santiment narrated a different story. Barring the short-term upticks at different intervals, the total NFT trading volume has plunged 67% from the peak of 6 February until 2 March.
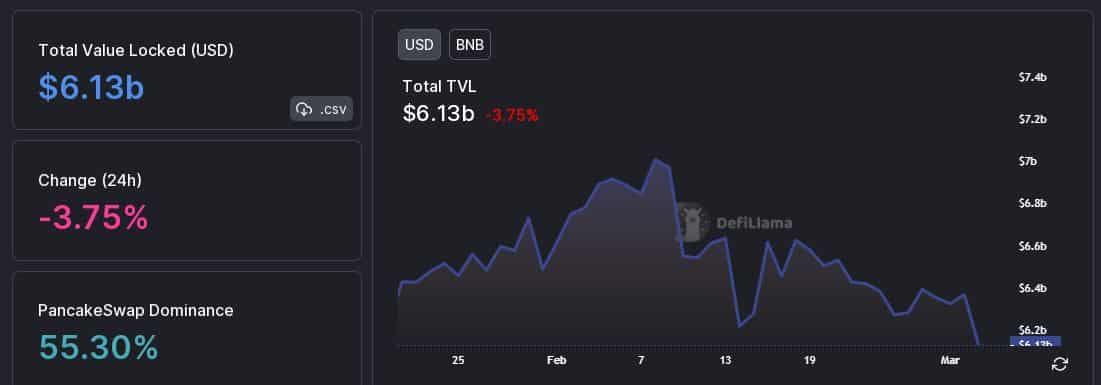
BNB Chain’s performance on the DeFi front also left a lot to be desired. The total value locked (TVL) declined by 12% over the last three weeks and dipped well below $7 billion.
Is your portfolio green? Check the Binance Coin Profit Calculator
Is BNB heading toward losses?
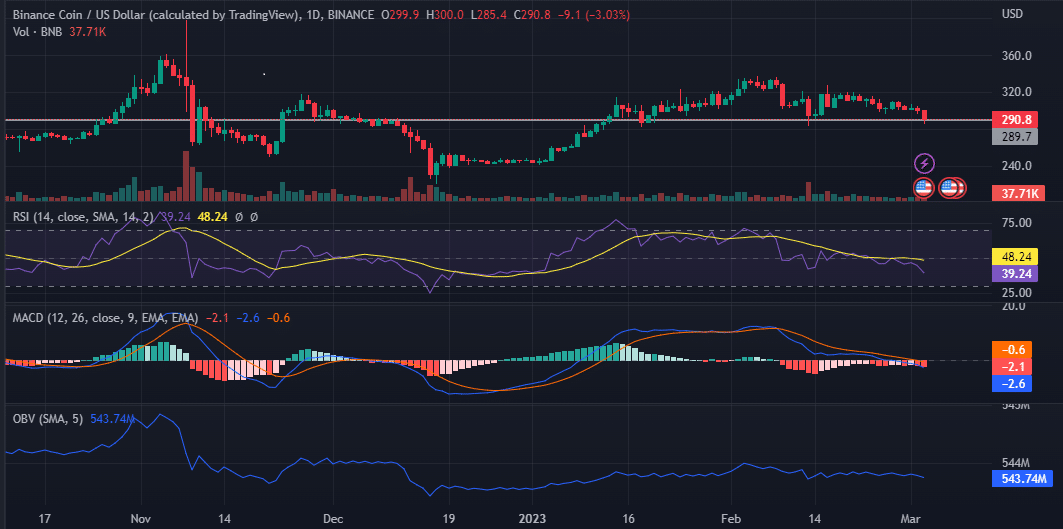
Binance Coin has shed more than 6% of its value in the last week and was down 2.7% in the last 24 hours, as per data from CoinMarketCap.
The Relative Strength Index (RSI) fell sharply over the last 10 days and dipped below 40, at the time of writing. This indicated that BNB faced increased selling pressure and could sink further.
The Moving Average Convergence Divergence (MACD) suggested a bearish outcome for the coin as well while the On Balance Volume (OBV) showed a marginal drop.
These indicators sounded a warning alarm for BNB and the support at $289 might not hold for good.