Ethereum Classic’s [ETC] consolidation extends- A bullish breakout likely
![Ethereum Classic’s [ETC] consolidation extends- A bullish breakout likely](https://ambcrypto.com/wp-content/uploads/2023/03/image-1200x800-10.png)
Disclaimer: The information presented does not constitute financial, investment, trading, or other types of advice and is solely the writer’s opinion
- The market was neutral on the 12-hour chart at press time.
- The funding rate and the weighted sentiment were negative at the time of writing.
Ethereum Classic [ETC] has been in a consolidation phase since mid-March. Price action hit a homestretch on its symmetrical triangle pattern at press time, pointing to a potential breakout.
Read Ethereum Classic’s [ETC] Price Prediction 2023-24
At the time of writing, ETC’s value was $20.03, a 0.2% change in the past 24 hours. On the other hand, Bitcoin [BTC] was toiling below the recent high of $28K.
A reclaim of $28K could tip bulls to inflict an upside breakout. However, a drop below $27K could attract bears to sink ETC below the symmetrical triangle pattern.
Is a patterned breakout likely?
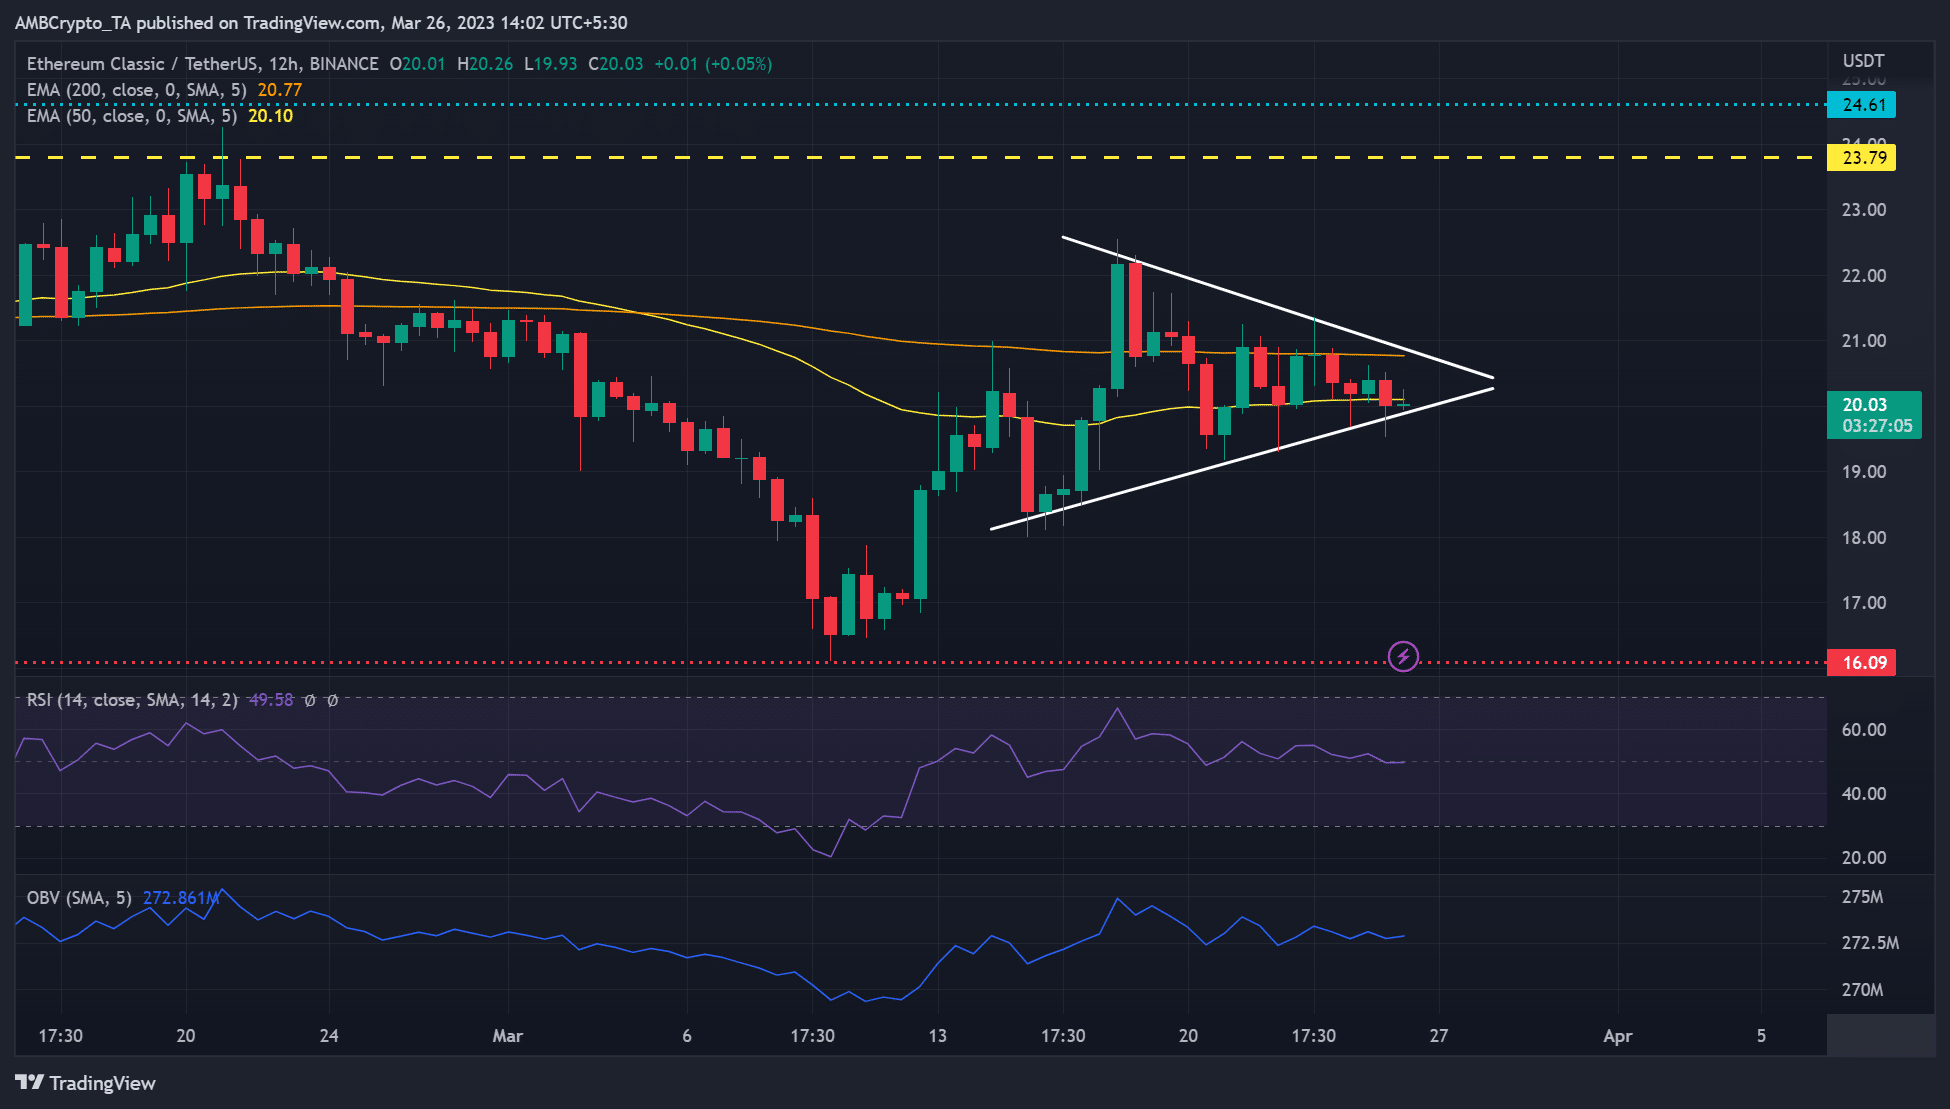
In the past few days, ETC oscillated between 50 EMA and 200 EMA, with the symmetrical triangle pattern’s boundaries checking excess spikes or drops.
At press time, the price action was heading to the triangle’s apex and could inflict a breakout. Typically, symmetrical triangle formations are trend continuation patterns, so a bullish breakout is highly likely because ETC was on a recovery path.
As such, ETC could shoot to $24.61, based on the triangle’s height. That would be a potential 18% hike. But bulls must clear the hurdle at $23.79 to reach the target. The $23.79 has been a stiff resistance in January and February.
Alternatively, bears could gain leverage if ETC closes below the channel’s lower boundary. The bearish breakout could exert sell pressure, setting ETC to slide to $16. However, the low liquidity zone of $18 could also reduce the drop and is worth watching out for.
At press time, the RSI fluctuated slightly above the 50 mark, indicating equal buying and selling pressure. Similarly, the OBV (On Balance Volume) fluctuated above $272M, reinforcing the lack of absolute market influence between buyers and sellers.
Funding rates and sentiment flipped to negative
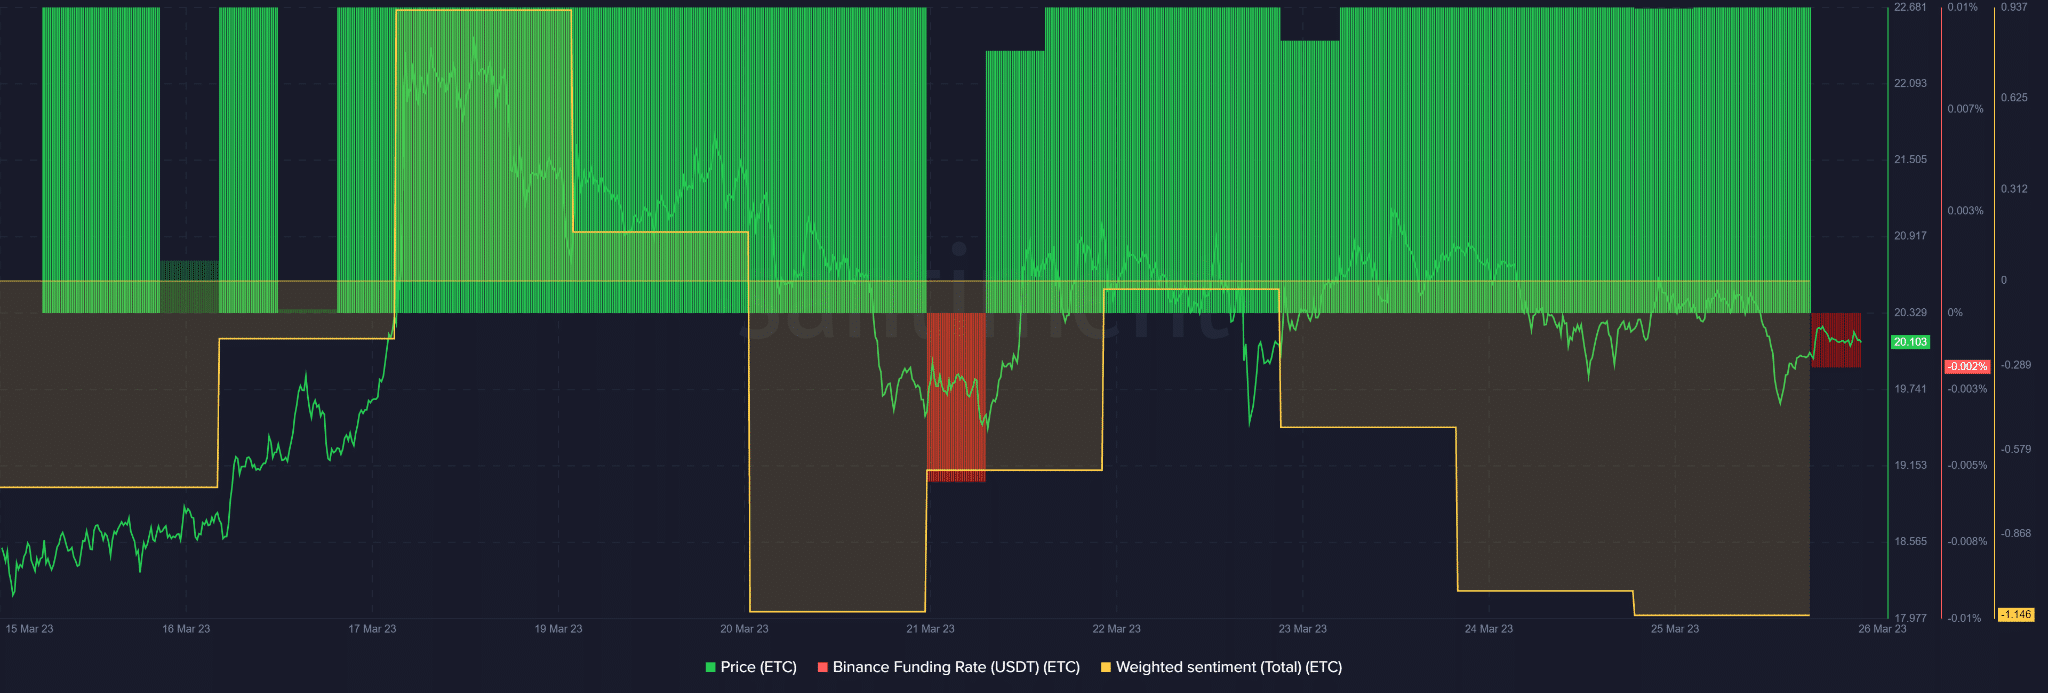
ETC’s weighted sentiment slid deeper into the negative territory, which could worry bulls. Similarly, the funding rates for ETC/USDT pair declined and flipped into negative, a bearish sentiment in the derivatives market. The trend could tip bears to inflict the breakout.
Is your portfolio green? Check out ETC Profit Calculator
Nonetheless, NFT trade volumes showed recovery on the ETC network. It surged to $11M on 25 March, short $5M to reach its mid-March high levels.
The surge in NFT sales volumes could improve investors’ confidence and overall sentiment on the native token, ETC. Investors should track BTC’s price action for better-optimized moves.