Polkadot formed a range on charts, watch out for these levels for a reversal

Disclaimer: The information presented does not constitute financial, investment, trading, or other types of advice and is solely the writer’s opinion.
- The confluence of resistance at the $6.6 region made it a significant zone of supply.
- Another rejection there would indicate the formation of a range.
The higher timeframe price chart of Polkadot showed a bearish leaning, even though the asset posted gains of 30% from 10 March to 18 March. The market structure remained bearish, and DOT appeared to trade within a range.
Read Polkadot’s [DOT] Price Prediction 2023-24
The bulls were able to halt the losses at the $5.3 level. During March the buyers were successful in pushing prices back above the $5.8-$6 region.
This was possible when euphoria gripped the crypto market when BTC rallied from $20.6k to $$28.8k.
The $6.6 bearish order block was not yet breached
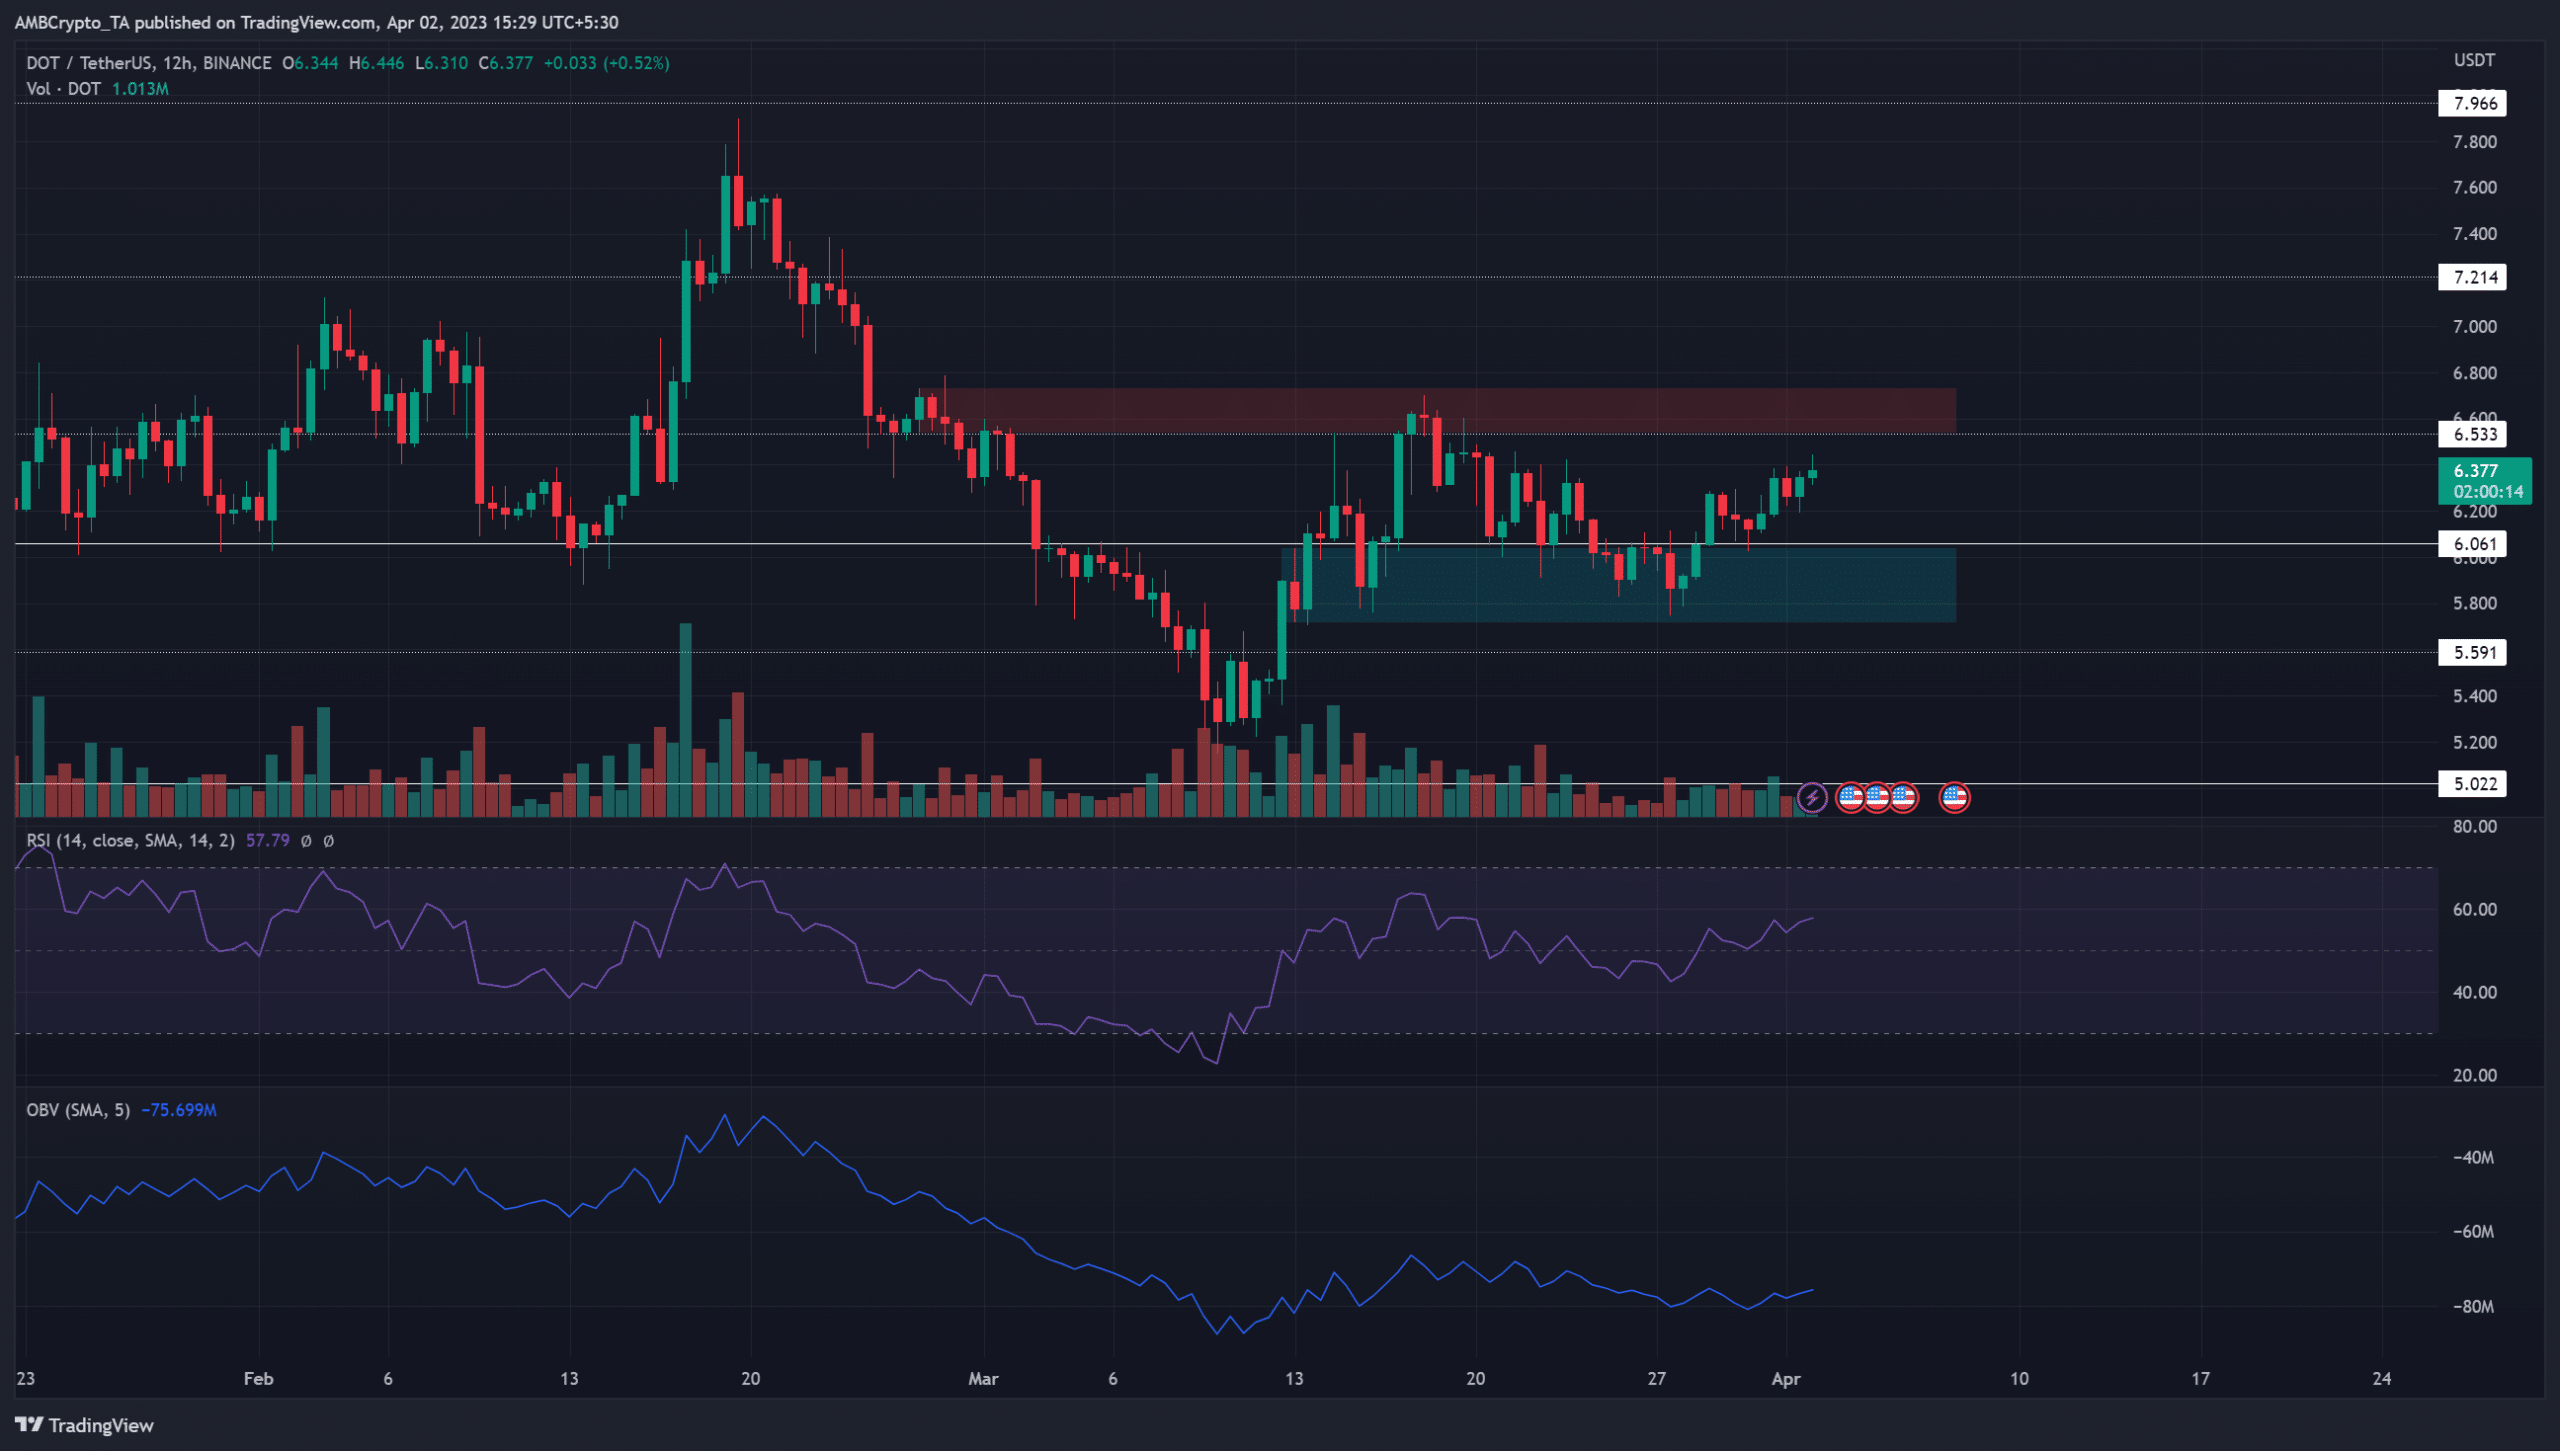
On the daily timeframe, the bearish structure of Polkadot was evident when we consider the fact that the drop in prices did not see a noticeable stall since mid-February when DOT saw a harsh rejection at the $7.75 mark. One of the bearish order blocks that DOT formed on the daily timeframe during this slide was highlighted by the red box in the $6.6 region.
Realistic or not, here’s DOT’s market cap in BTC terms
But the recovery of DOT did not yet shift the structure, as the local high formed on 18 March at $6.7 was only a lower high in the downtrend. This has confluence with the bearish order block at the $6.6 region from late February.
The RSI showed some bullish momentum but did not yet show a strong uptrend in progress. Meanwhile, the OBV was flat in the past week and has slid southward from mid-March.
The lower timeframe sentiment strongly favored bulls
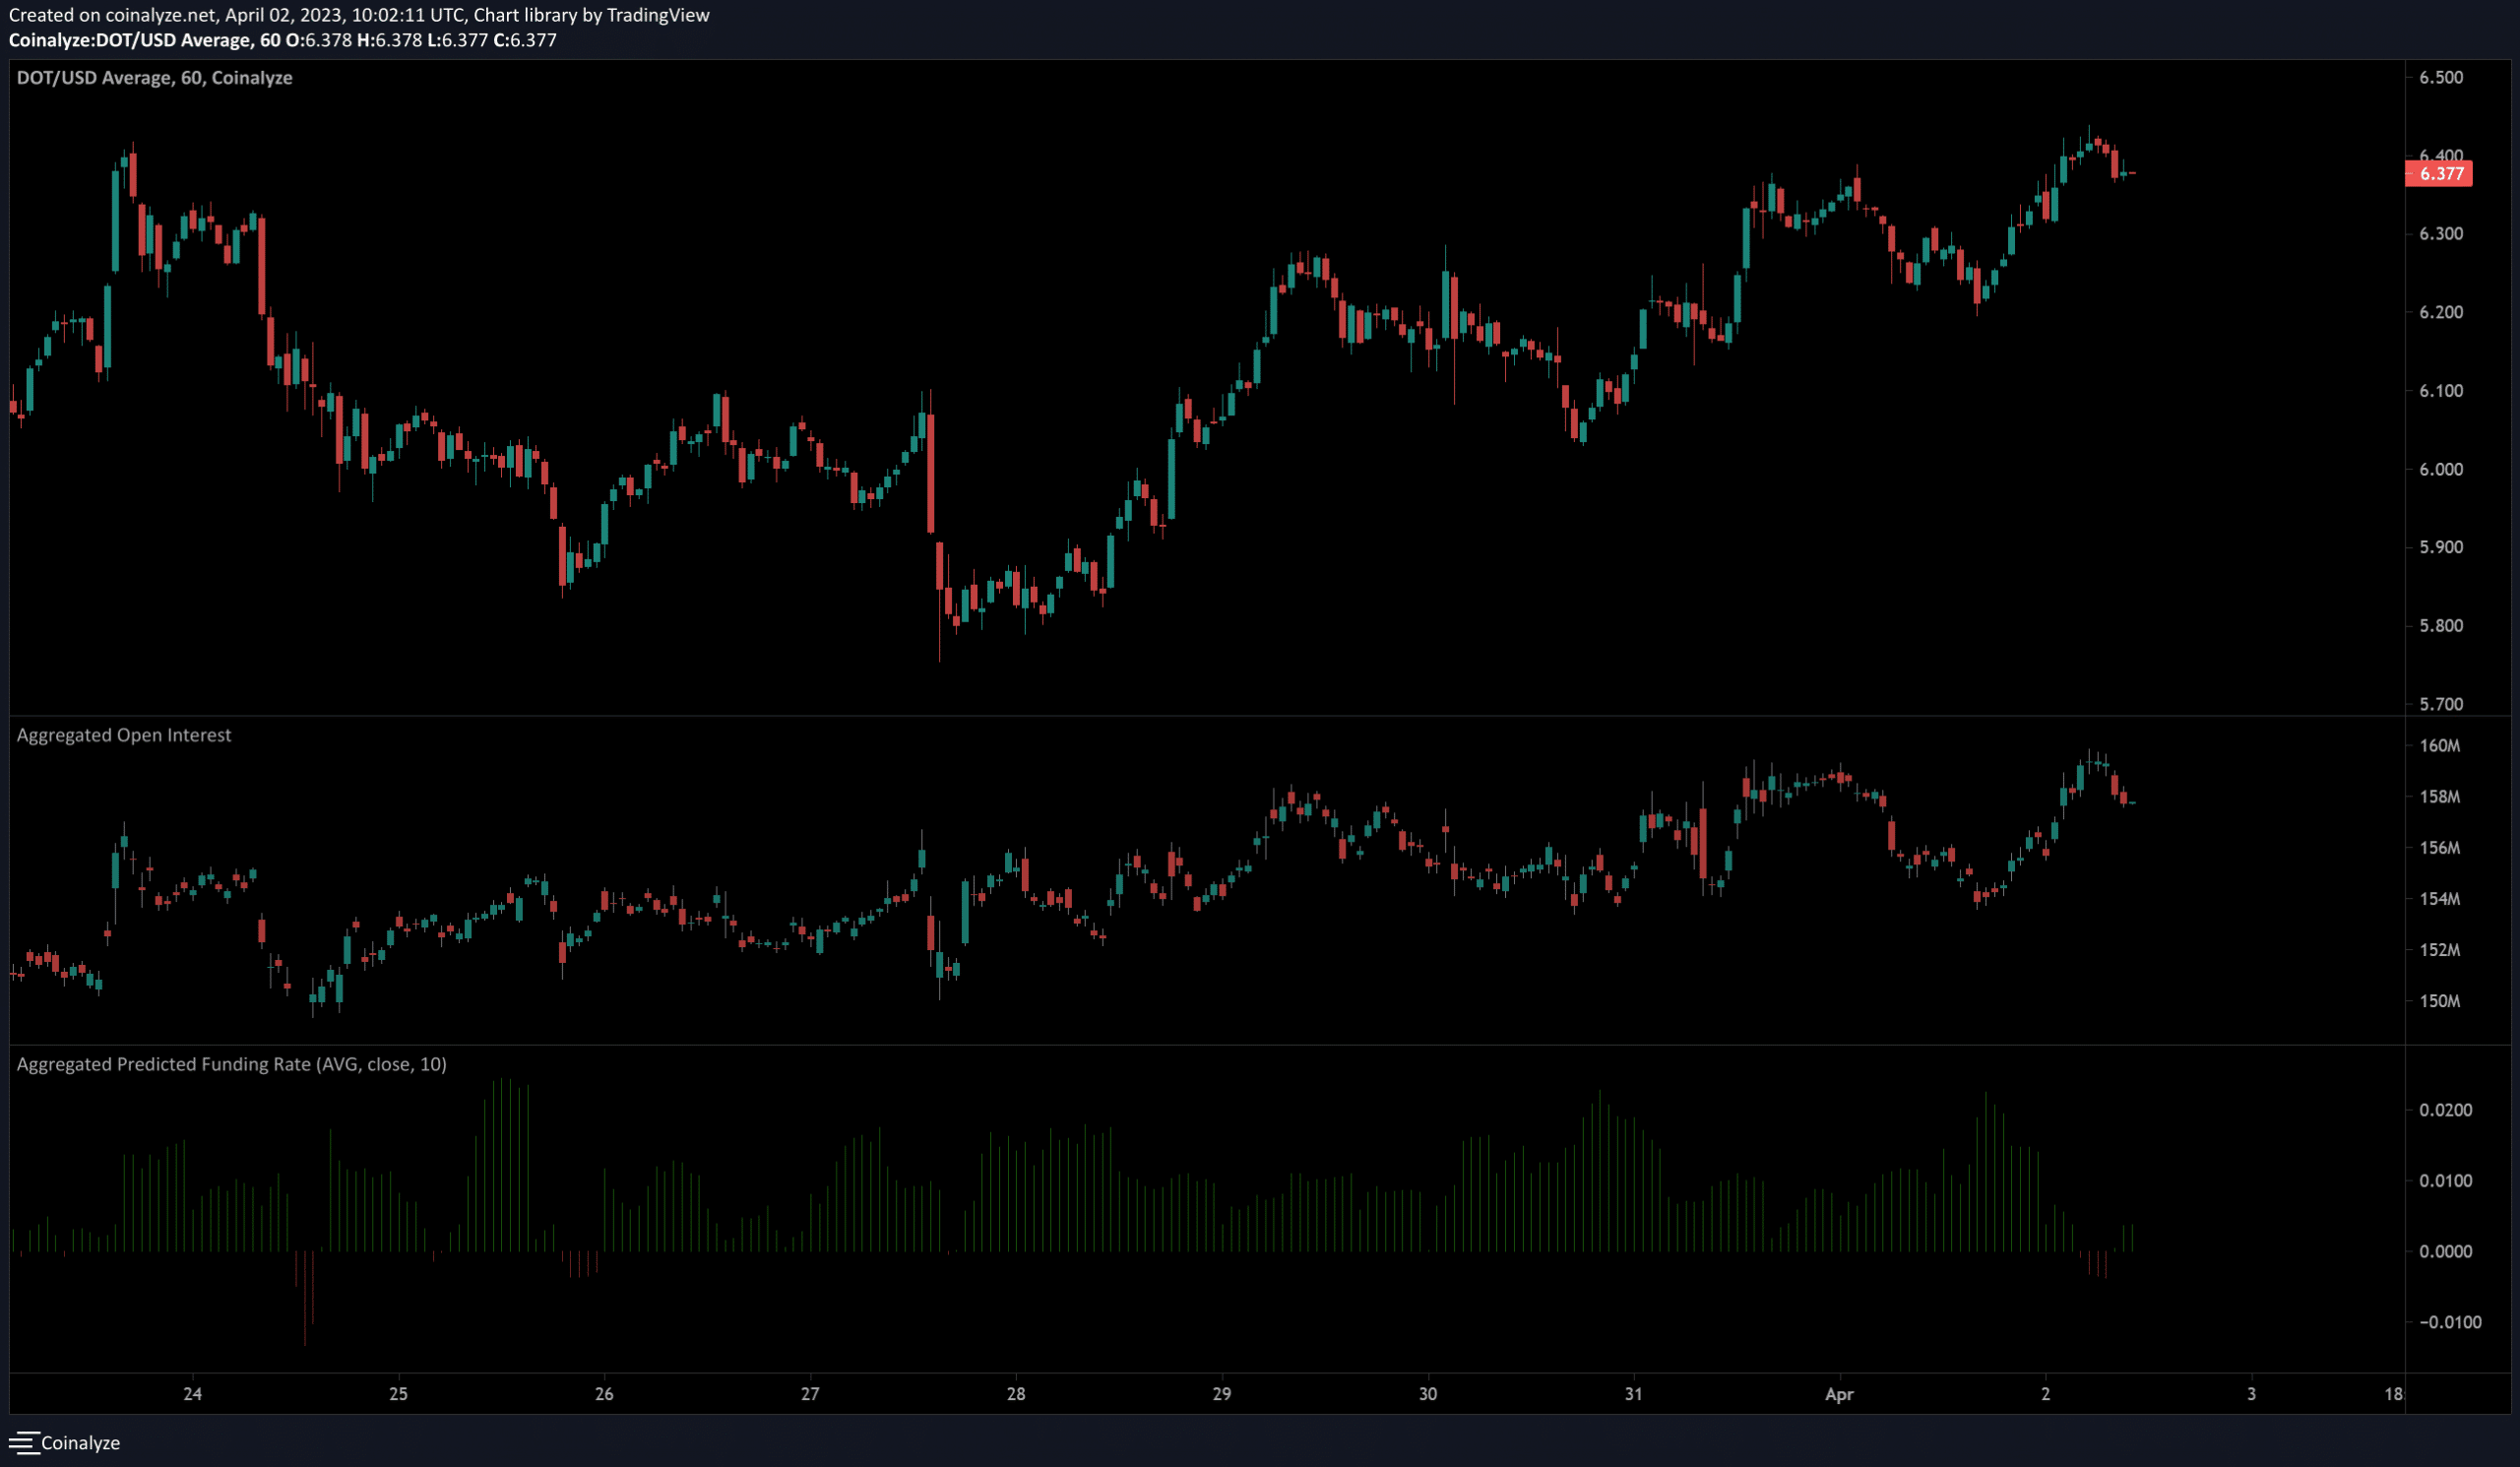
On the 1-hour chart above we can see that the funding rate has recovered and was back in positive territory. This denoted bullish sentiment in the market. Coinalyze data also showed Open Interest was on the rise alongside DOT prices.
This indicated bullish sentiment in the short-term as buyers appear ready and willing to bid on any DOT dips. Hence, DOT could register further gains in the near term to reach the $6.6 resistance. Thereafter, a rejection would indicate the formation of a range for Polkadot from $5.85-$6.6.