Can Solana’s TVL surge alter SOL’s ongoing trajectory? Assessing…

- Solana saw a 14% increase in TVL in the last 30 days.
- SOL was trading at around $23 at the time of writing.
While Solana has been enjoying tranquil days lately, its Total Value Locked (TVL) has been on a journey uphill, as revealed by recent data. Might this gradual upswing in TVL ignite a cascade of enhancements within the network and for the SOL token?
Read Solana’s [SOL] Price Prediction 2023-24
Solana sees uptrend in TVL
In a recent post by Messari, the TVL growth across prominent blockchain networks was analyzed. Amongst these networks, Solana stood out with a remarkable surge in TVL. The surge was in stark contrast to the losses experienced by other chains over the past month.
Illustrated vividly on the chart, Solana showcased an impressive growth of over 14% in its TVL. Only Optimism had a positive TVL aside from Solana among all the examined chains.
Analyzing the Solana TVL
DefiLlama’s data illustrated the trajectory of Solana’s TVL witnessed a surge over the recent months. The chart painted a picture depicting the commencement of a significant upward journey around 29 June.
Initially, the TVL meandered within the range of $240 million to $260 million. However, following its upward surge, it ventured into territory exceeding $300 million, reaching a peak of over $324 million on 14 July.
As of this writing, the TVL was around $308 million, showcasing a slight rise after its initial dip from the year-to-date zenith. Furthermore, an intriguing pattern emerged as the user base was analyzed.
Except for spikes in May, the user count on the platform remained remarkably stable. The chart illustrated this steady trend, where the number of users exhibited a persistent equilibrium devoid of any discernible decline.
SOL bear trend weakens
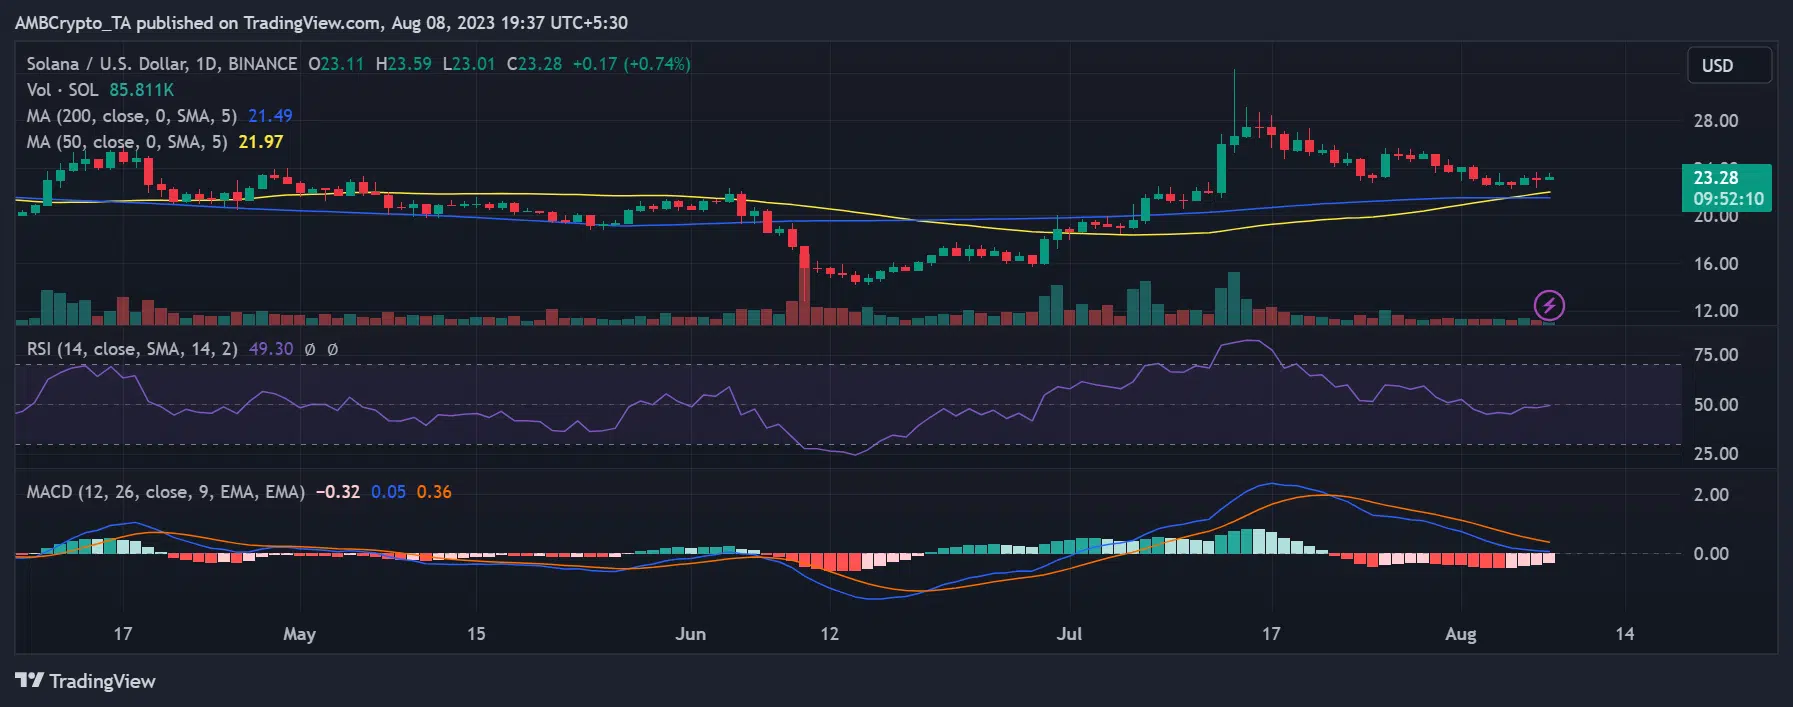
On the daily timeframe chart, Solana’s journey, post its 8% ascent on 26 July, hasn’t managed to forge a substantial trajectory. Instead, the chart reflected more of a decline rather than a resurgence.
As of this writing, it was trading at around $23.2, displaying a modest increase of less than 1%. Despite the lackluster price movement, SOL maintained its position above the short Moving Average (yellow line).
This was a testament to the momentum it garnered from the upward trend observed a few weeks earlier.
– Realistic or not, here’s SOL market cap in BTC’s terms
Examining its Relative Strength Index (RSI), the current phase for Solana showcased a bearish trend. However, this bearish sentiment was relatively weak, as the RSI line teetered slightly below the neutral line.


