Why Bitcoin changing hands could have a ‘historical effect’

- More long-term holders are letting go of their Bitcoin into the hands of their short-term counterparts.
- A noteworthy Bitcoin recovery may occur in 2024 as indicated by historical data.
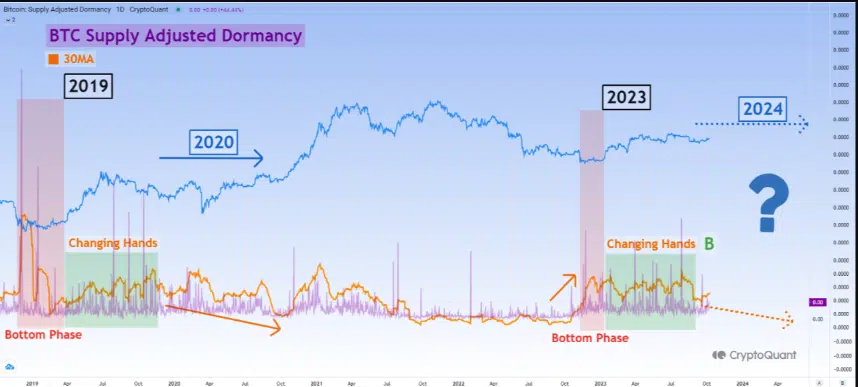
Hands holding Bitcoin [BTC] are actively changing, according to a recent revelation by Korean on-chain analyst Yonsei_dent. The analyst disclosed this in his 8 October analysis published on CryptoQuant.
Read Bitcoin’s [BTC] Price Prediction 2023-2024
One metric he used in coming up with the conclusion was the Bitcoin Supply-Adjusted Dormancy.
Bitcoin’s movement could drive recovery
The Bitcoin Supply-Adjusted Dormancy simply refers to the average time required for each Bitcoin to change hands, based on the last transfer of the specific BTC in question. Dormancy reaches peak values as more coins are issued and accumulated by the aggregate network.
Based on Yonsei’s analysis, there has been a rapid increase in dormancy lately, meaning that Short Term Holders (STHs) are actively buying BTC from Long Term Holders (LTHs).
But that wasn’t the only point that the analyst was trying to make. For Yonsei, history almost always seems to repeat itself in every cycle, and this current dormancy condition could drive a BTC recovery.
Yonsei opined that the revival may not be immediate. However, he mentioned that it was likely for the impact to reflect in 2024 as it happened between 2019 and 2020.
He added that,
“The point is that the movement of the price and Dormancy are quite similar to those in 2019 when the market went from the bottom to the recovery period. Although 2020 showed a bore sideways movement (excluding the COVID-19 shock period), it is confirmed that a huge portion of BTC supply was transferred to STH as the Dormancy indicator decreased overall.”
Not yet close to the top
On looking at the LTH Market Value to Realized Value (MVRV), Glassnode showed that there has been a substantial increase in the metric between 2022 and press time. The metric serves as an indicator to evaluate the behavior of long-term investors.
Also, it is noteworthy to mention that it takes into consideration only UTXOs with a lifespan of at least 155 days. From the chart above, Bitcoin’s LTH MVRV was 1.35. Usually, a value above 10 coincides with market tops, as seen in previous cycles.
Therefore, the current BTC value seems closer to the bottom, and there could be more room for its growth. Meanwhile, it is possible that Bitcoin’s next increase could come from Asia’s accumulation rather than the U.S.
This is because of the contrasting state of the Korea Premium Index and Coinbase Premium Index. At press time, the Coinbase Premium Index was flat out at 0.009. Its Korean counterpart was, however, higher at 1.03.
Is your portfolio green? Check out the BTC Profit Calculator
This disparity means that buying pressure for Bitcoin may rise from the Asian part instead of the U.S. This could be linked to the hostile condition the crypto market has been enduring in the Joe Biden-led nation.
Additionally, Bitcoin research analyst Axel Adler noted that LTH supply was still much more than STHs despite the recent change of hands.
Bitcoin STH Supply vs LTH Supply (%) – shows how the supply shifts from one cohort to another.
As of today, LTH hold 15.7M BTC or (86.18%), and STH hold 2.5M BTC or 13.82%. pic.twitter.com/I7GDQqyKnm
— Axel ?? Adler Jr (@AxelAdlerJr) October 9, 2023


