MATIC, LINK post recoveries: Is this the reason why?
MATIC and LINK have fallen below their supports, but could recent accumulation help the price trend upward again?

- Over $3 million worth of MATIC and LINK have been accumulated in the past few days.
- MATIC and LINK’s values have increased in the last 24 hours.
As per Lookonchain, on the 20th of December, newly created wallets withdrew 24,860 Chainlink [LINK] tokens, valued at $3.5 million, and 5 million Polygon [MATIC] tokens, valued at $3.13 million, from the Binance [BNB] exchange.
How does this recent accumulation compare to the current exchange flow of these assets?
Polygon and Chainlink see different accumulation pattern
As a result of the above report, AMBCrypto analyzed CryptoQuant for Polygon’s exchange flow, which indicated that the recent accumulation by the new wallet did not counter the substantial inflow.
At the time of this update, MATIC’s exchange flow had remained positive. It was at its highest point in recent days, sitting at 15.4 million.
This signified that a significant amount of MATIC tokens were entering exchanges, overshadowing the volume being accumulated.

In contrast, Chainlink exhibited an accumulation pattern based on its exchange flow. The chart illustrated a trend of outflow over the past couple of days, as indicated by the negative exchange netflow.
As of this writing, the NetFlow was around -411,565. The current trend suggested that holders retained their positions rather than sell.

MATIC and LINK see slight recoveries
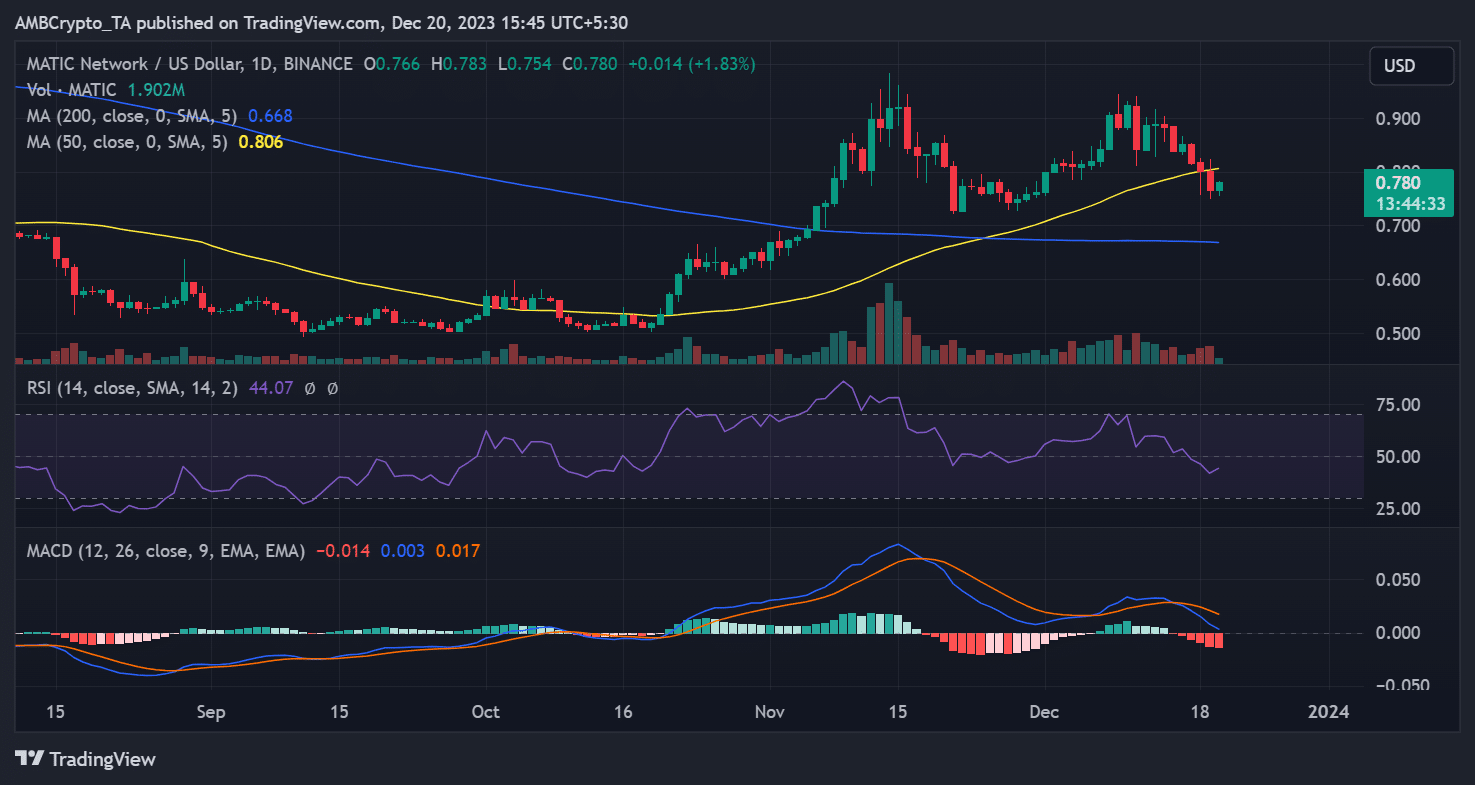
AMBCrypto’s analysis of Polygon’s daily timeframe price movement revealed the reason behind the recent surge in exchange inflow. The chart showed a recent decline in the price over the past few days.
The extent of this decline became evident as the price dropped below its short-moving average (yellow line). The yellow line had previously served as a support level around the $0.8 price range.
As of press time, Polygon was trading with a 1.8% increase in value, around $0.7.
Read Polygon’s [MATIC] Price Prediction 2023-24
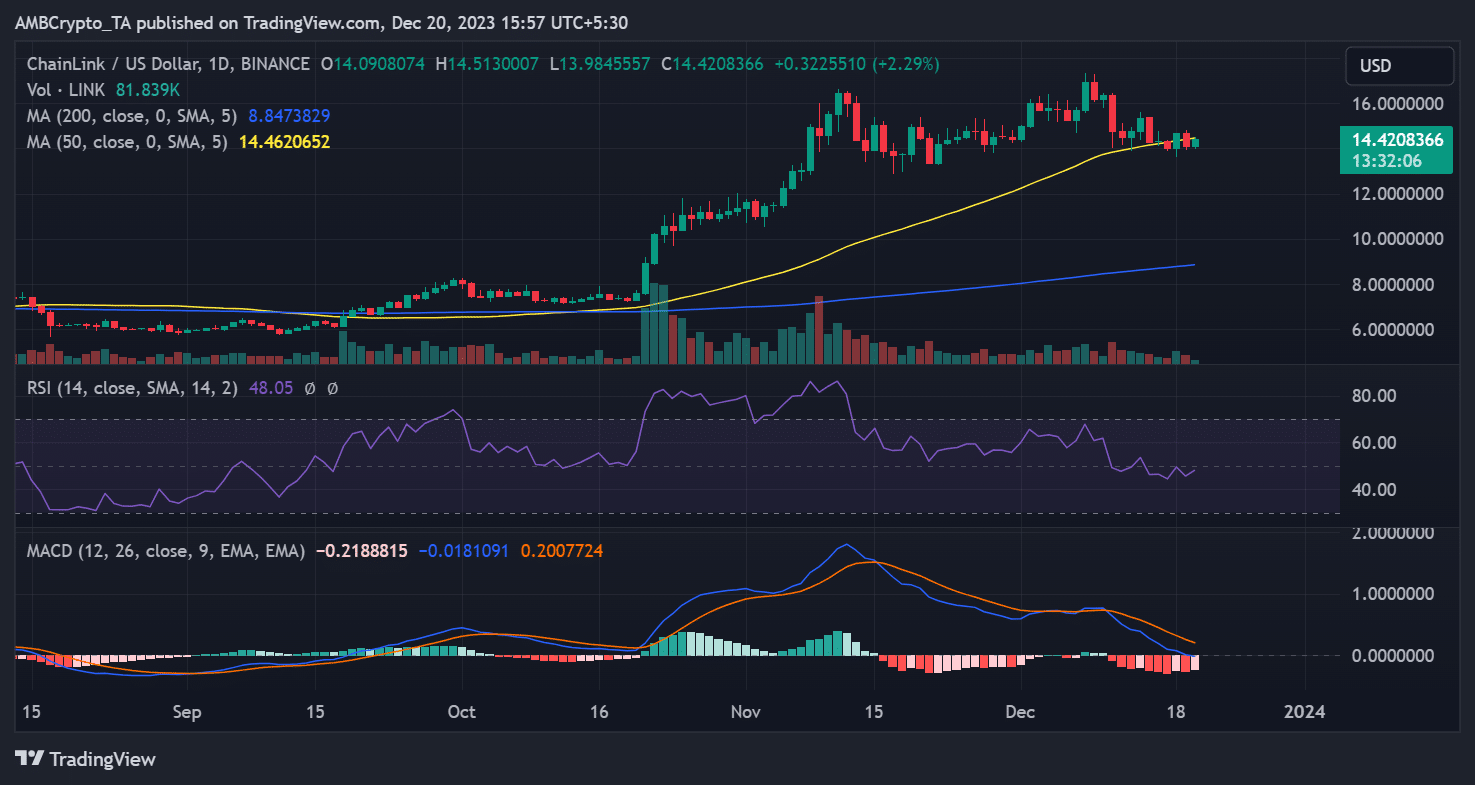
Like MATIC, LINK experienced a drop below its yellow line, although the decline was not as pronounced. At the time of this writing, the token was trading at around $14.4, reflecting a modest increase of over 2%.
Furthermore, its Relative Strength Index (RSI) line remained below the neutral line, signaling a bearish trend despite the recent uptick in price.