Solana: $110 price predictions gain traction again, here’s why
A drop in SOL's prices below $90 wouldn't see as many liquidation levels hit as a rally past $100.

- Solana developed a bearish market structure.
- The liquidity above $100 could attract prices before a reversal.
Solana [SOL] was stuck in a downtrend over the past month. The prices slid from $126, reaching $79 on the 23rd of January, but a recovery appeared to be underway.
Despite the 23% gains within the past week, the technical structure remained bearish.
In other news, Solana secured the third-highest NFT sales volume over the past week. However, this impressive feat might be no guarantee of a positive price performance over the coming days.
Discussing the implication of the recent breakout
As mentioned earlier, the past month saw Solana’s prices trend downward steadily.
This series of lower highs and lower lows has not been breached yet, meaning the market structure on the 12-hour chart was still bearish.
Yet, the descending channel (purple) has been broken. This presented a potential buying opportunity, but it was also risky since buyers could be caught offside with a failed breakout.
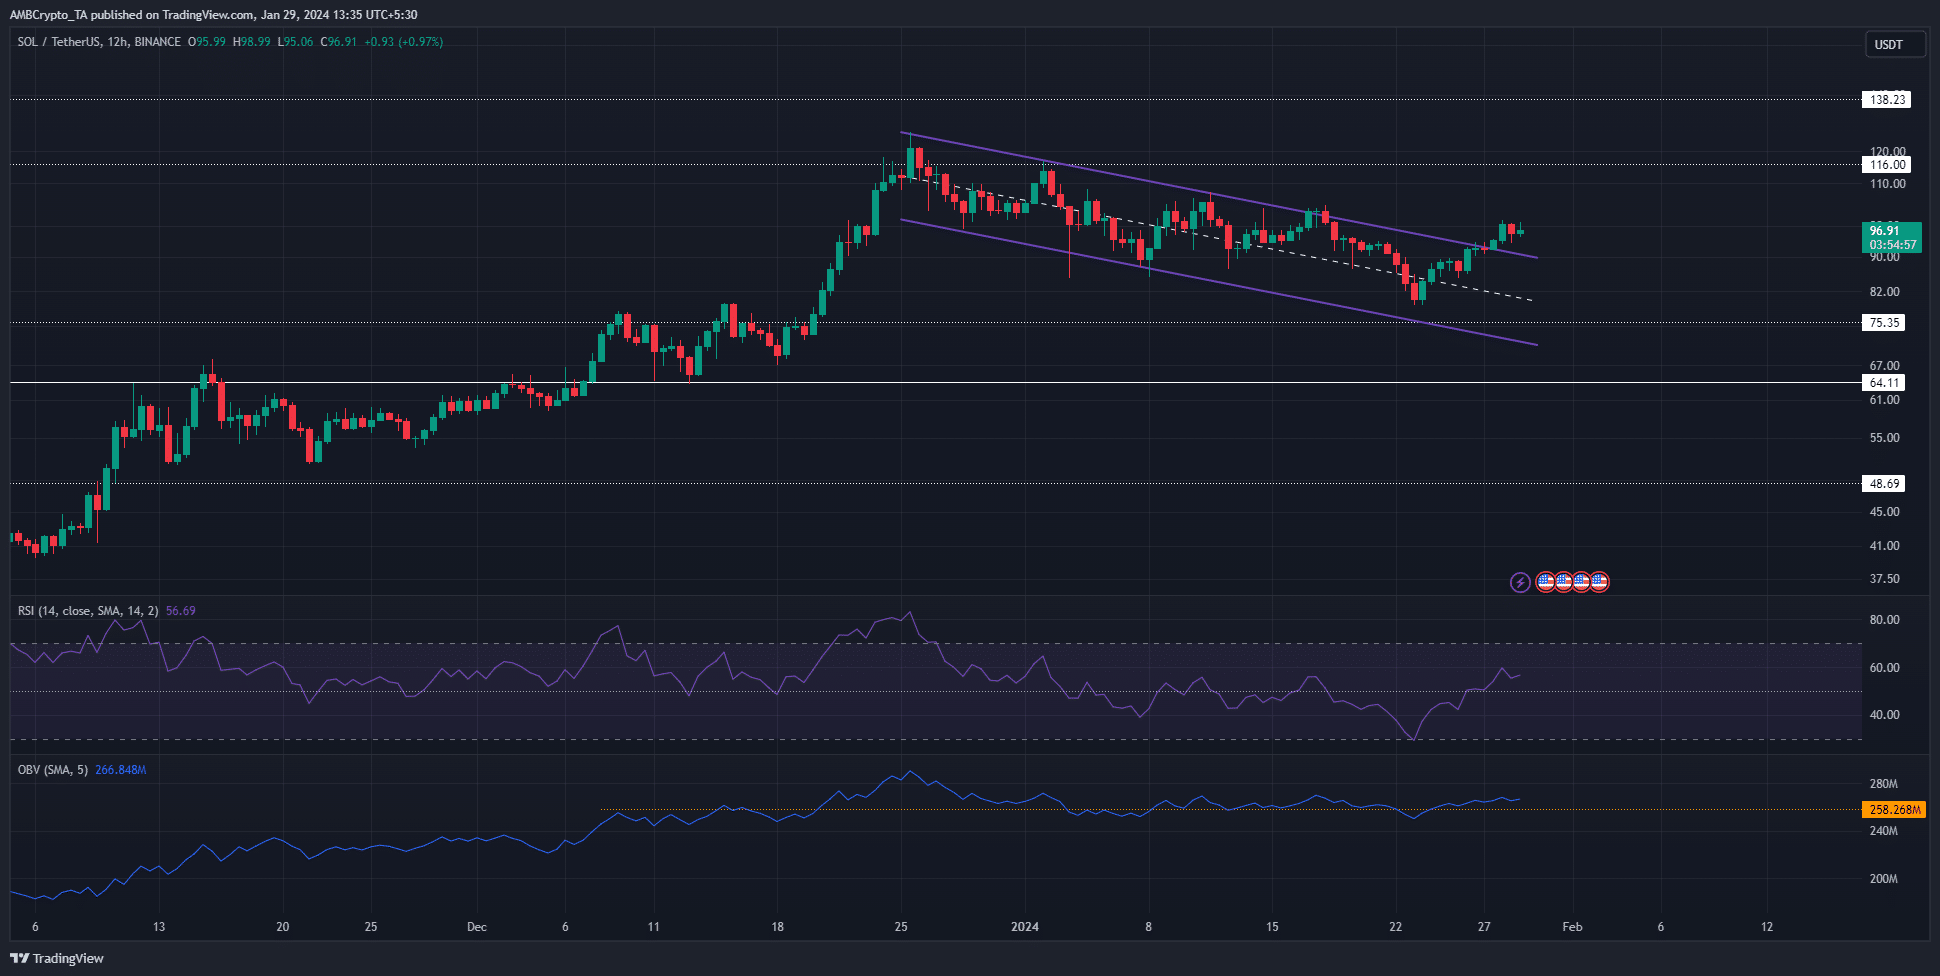
The RSI climbed above neutral 50 to reflect bullish momentum was in play. Yet, the OBV clung to the December highs. Its inability to climb higher in the past two months was a sign of muted buying volume.
This supported the idea that SOL would likely be unable to climb past the $100 mark anytime soon.
The heatmaps illuminated where SOL bulls could face rejection
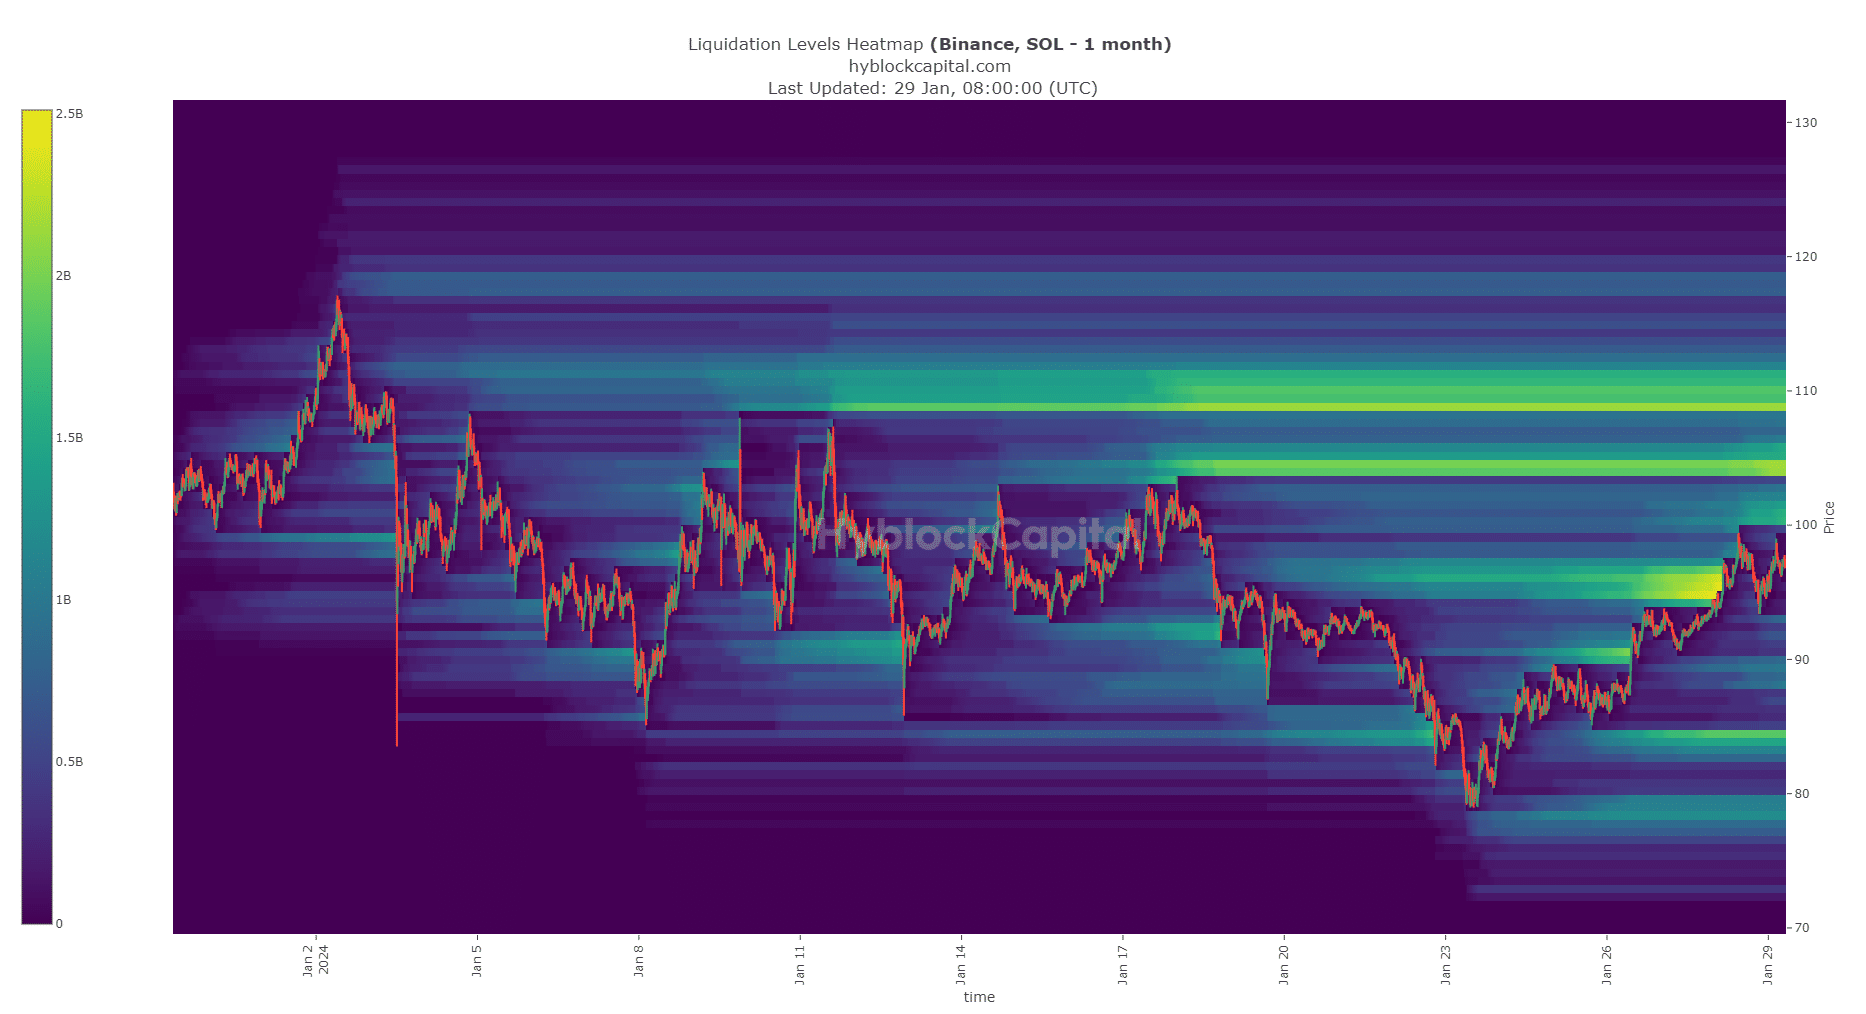
The past month’s trading saw three key resistance regions develop. The first two were the $110 and $104 regions, which had more than $2 billion in estimated liquidation levels.
The third was the $94.2-$97.2 area.
Is your portfolio green? Check out the SOL Profit Calculator
The bounce on the 28th of January saw these levels visited before a dip to the $93.5 mark. With the vast amount of liquidity to the north, a run to the $112-$115 region appeared highly likely.
A drop in prices wouldn’t see as many liquidation levels hit.
Disclaimer: The information presented does not constitute financial, investment, trading, or other types of advice and is solely the writer’s opinion.