Why Bitcoin investors haven’t given up despite BTC crossing $72K
The confidence of Bitcoin investors grows even as profit-taking continues.

- BTC surged briefly to the $72,000 price range.
- The volume of accumulation has grown recently.
Bitcoin [BTC] recently experienced a surge that propelled it beyond its previous all-time highs, setting the stage for potential new records.
Amidst these substantial price increases, data indicates that investors witnessed increased inflows, signaling a positive trend for the asset.
Bitcoin investors demand more
The recent surge in Bitcoin’s price over the past few days has coincided with an increase in accumulation.
AMBCrypto’s of BTC’s Inflows to Accumulation Addresses via CryptoQuant revealed that both the volume and balance of the addresses had reached their highest points in a considerable timeframe at press time.
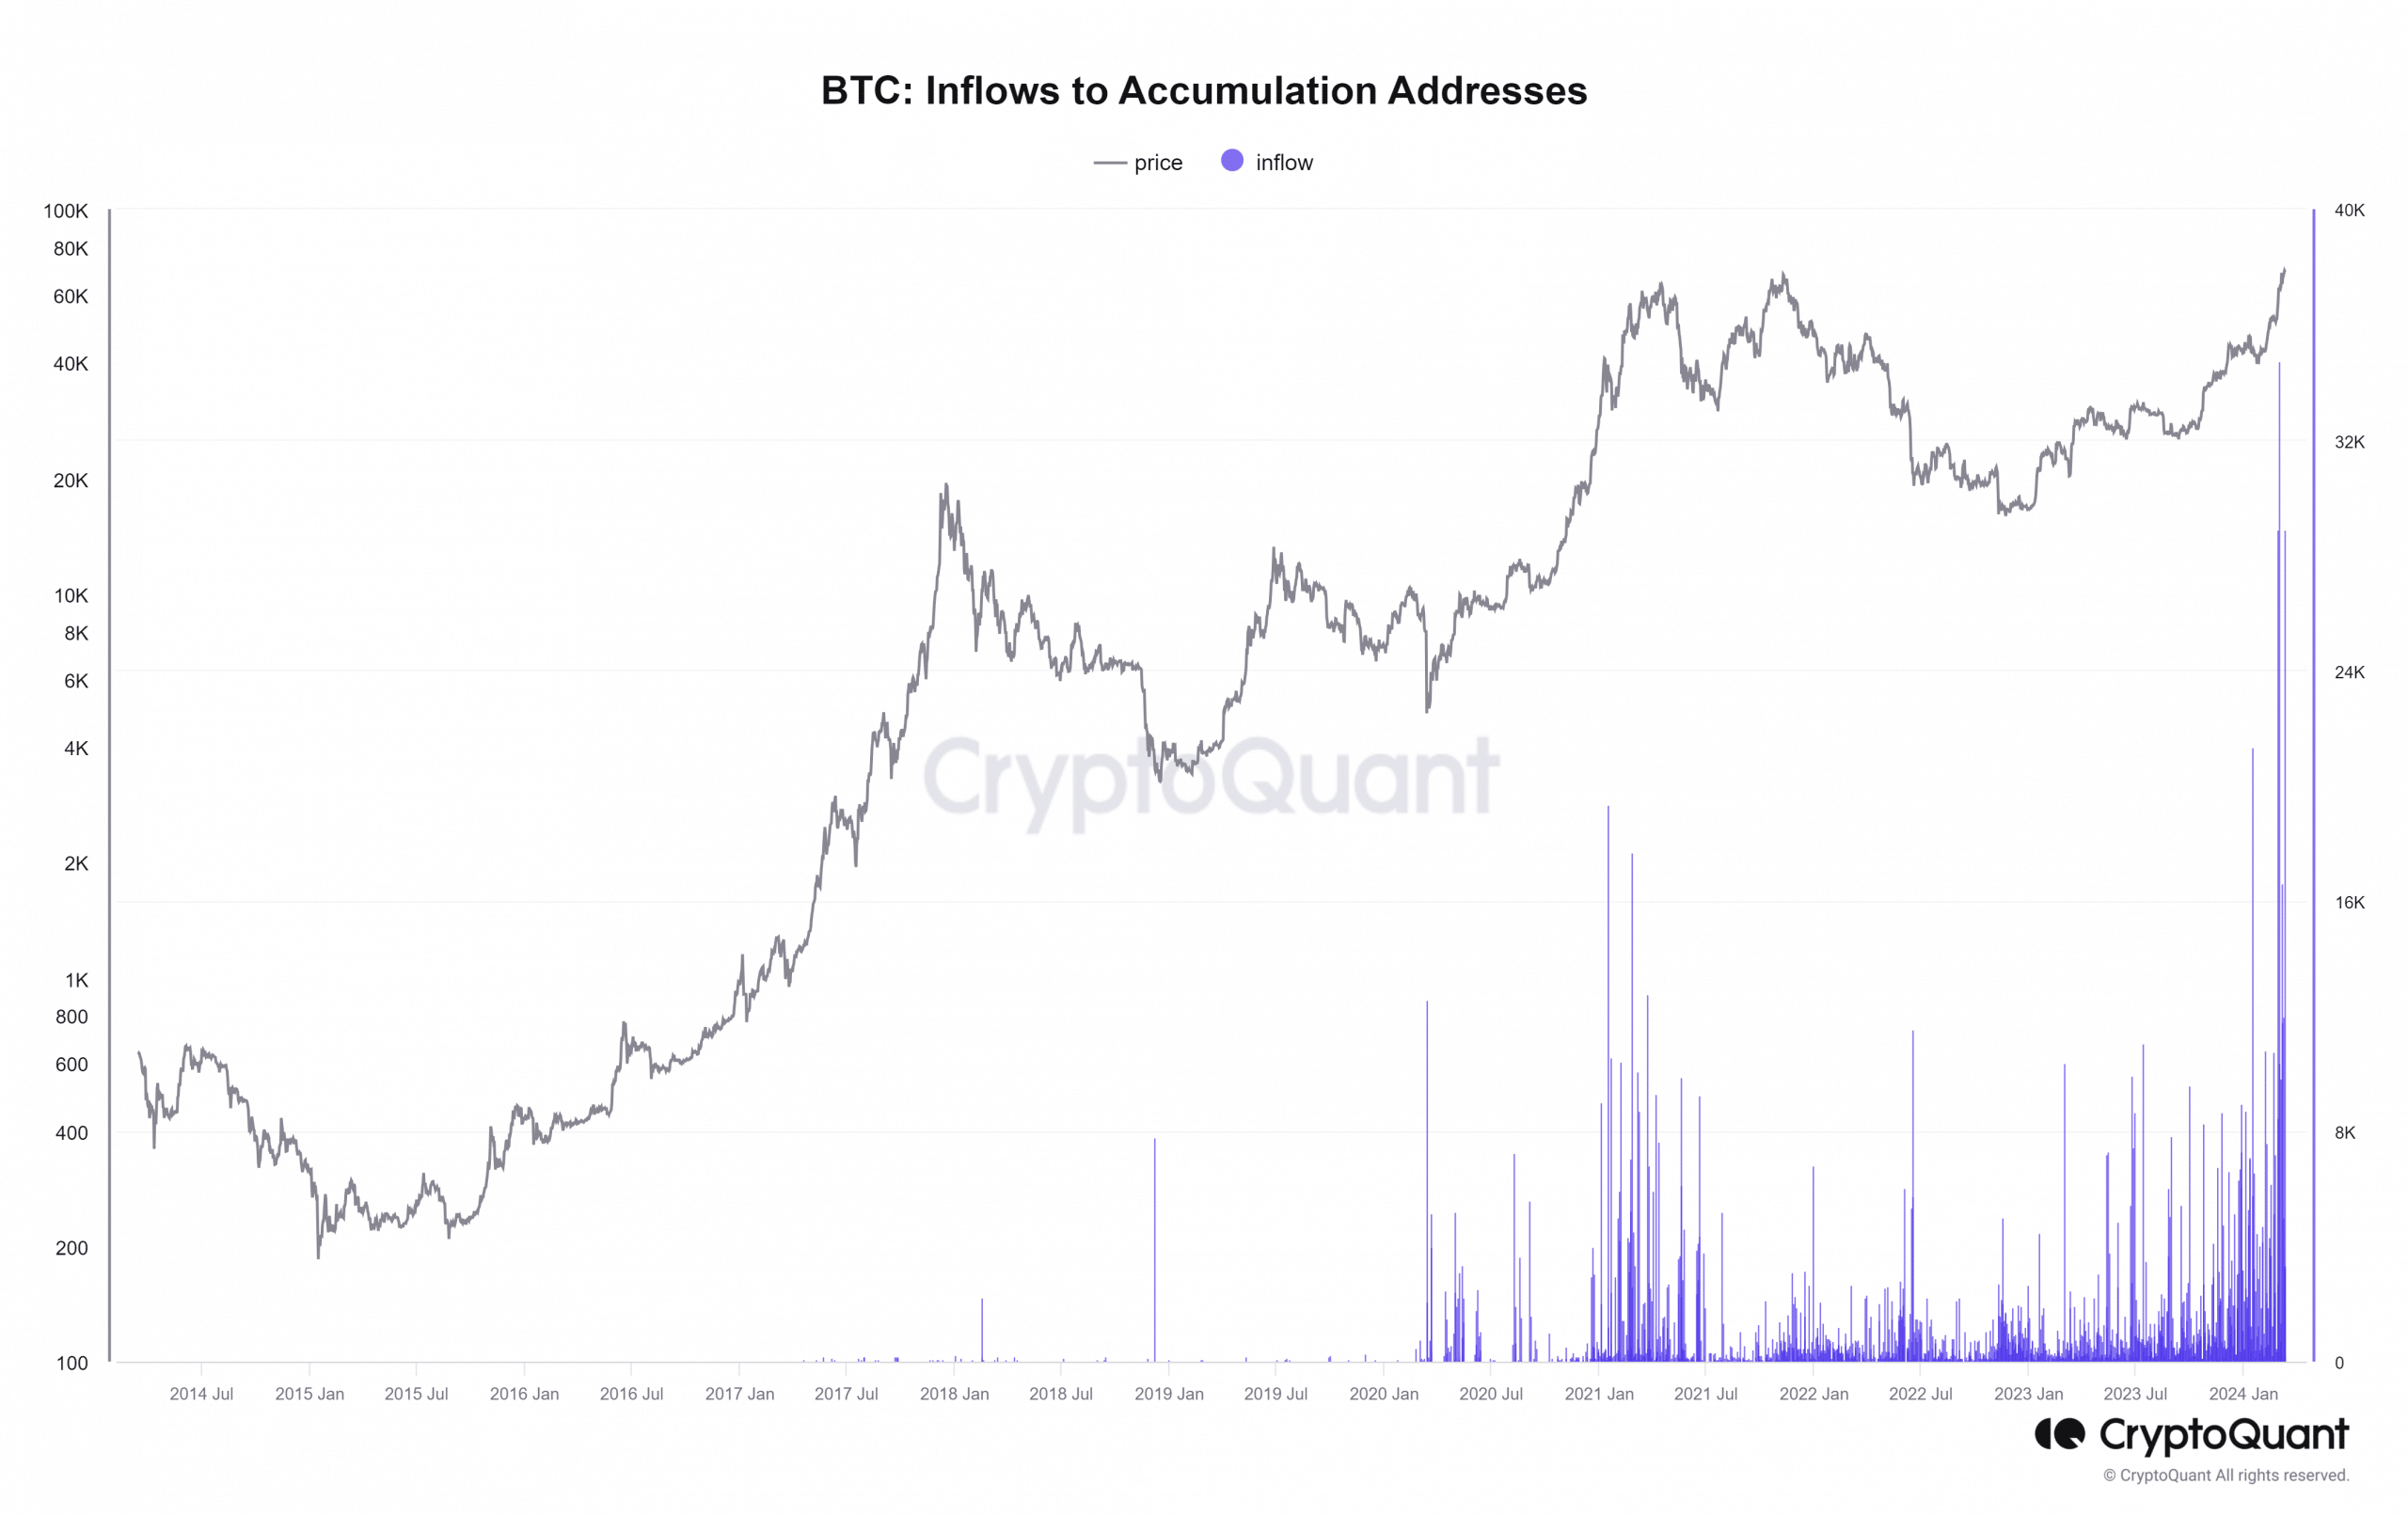
As of the 11th of March, the inflow exceeded 28,000 BTC, and the cumulative balance in these addresses surpassed 1 million BTC. This suggested growing demand from investors.
More Bitcoin holders send holdings to exchanges
Despite the noticeable increase in Bitcoin accumulation by investors, some traders have opted to capitalize on profits.
When AMBCrypto took a closer look at Bitcoin’s exchange flow chart, we noticed that the current week showed greater inflows than outflows.
Particularly, on the 11th of March, during a significant price surge, the dominance of inflow was evident, with over 5,000 BTC entering exchanges.
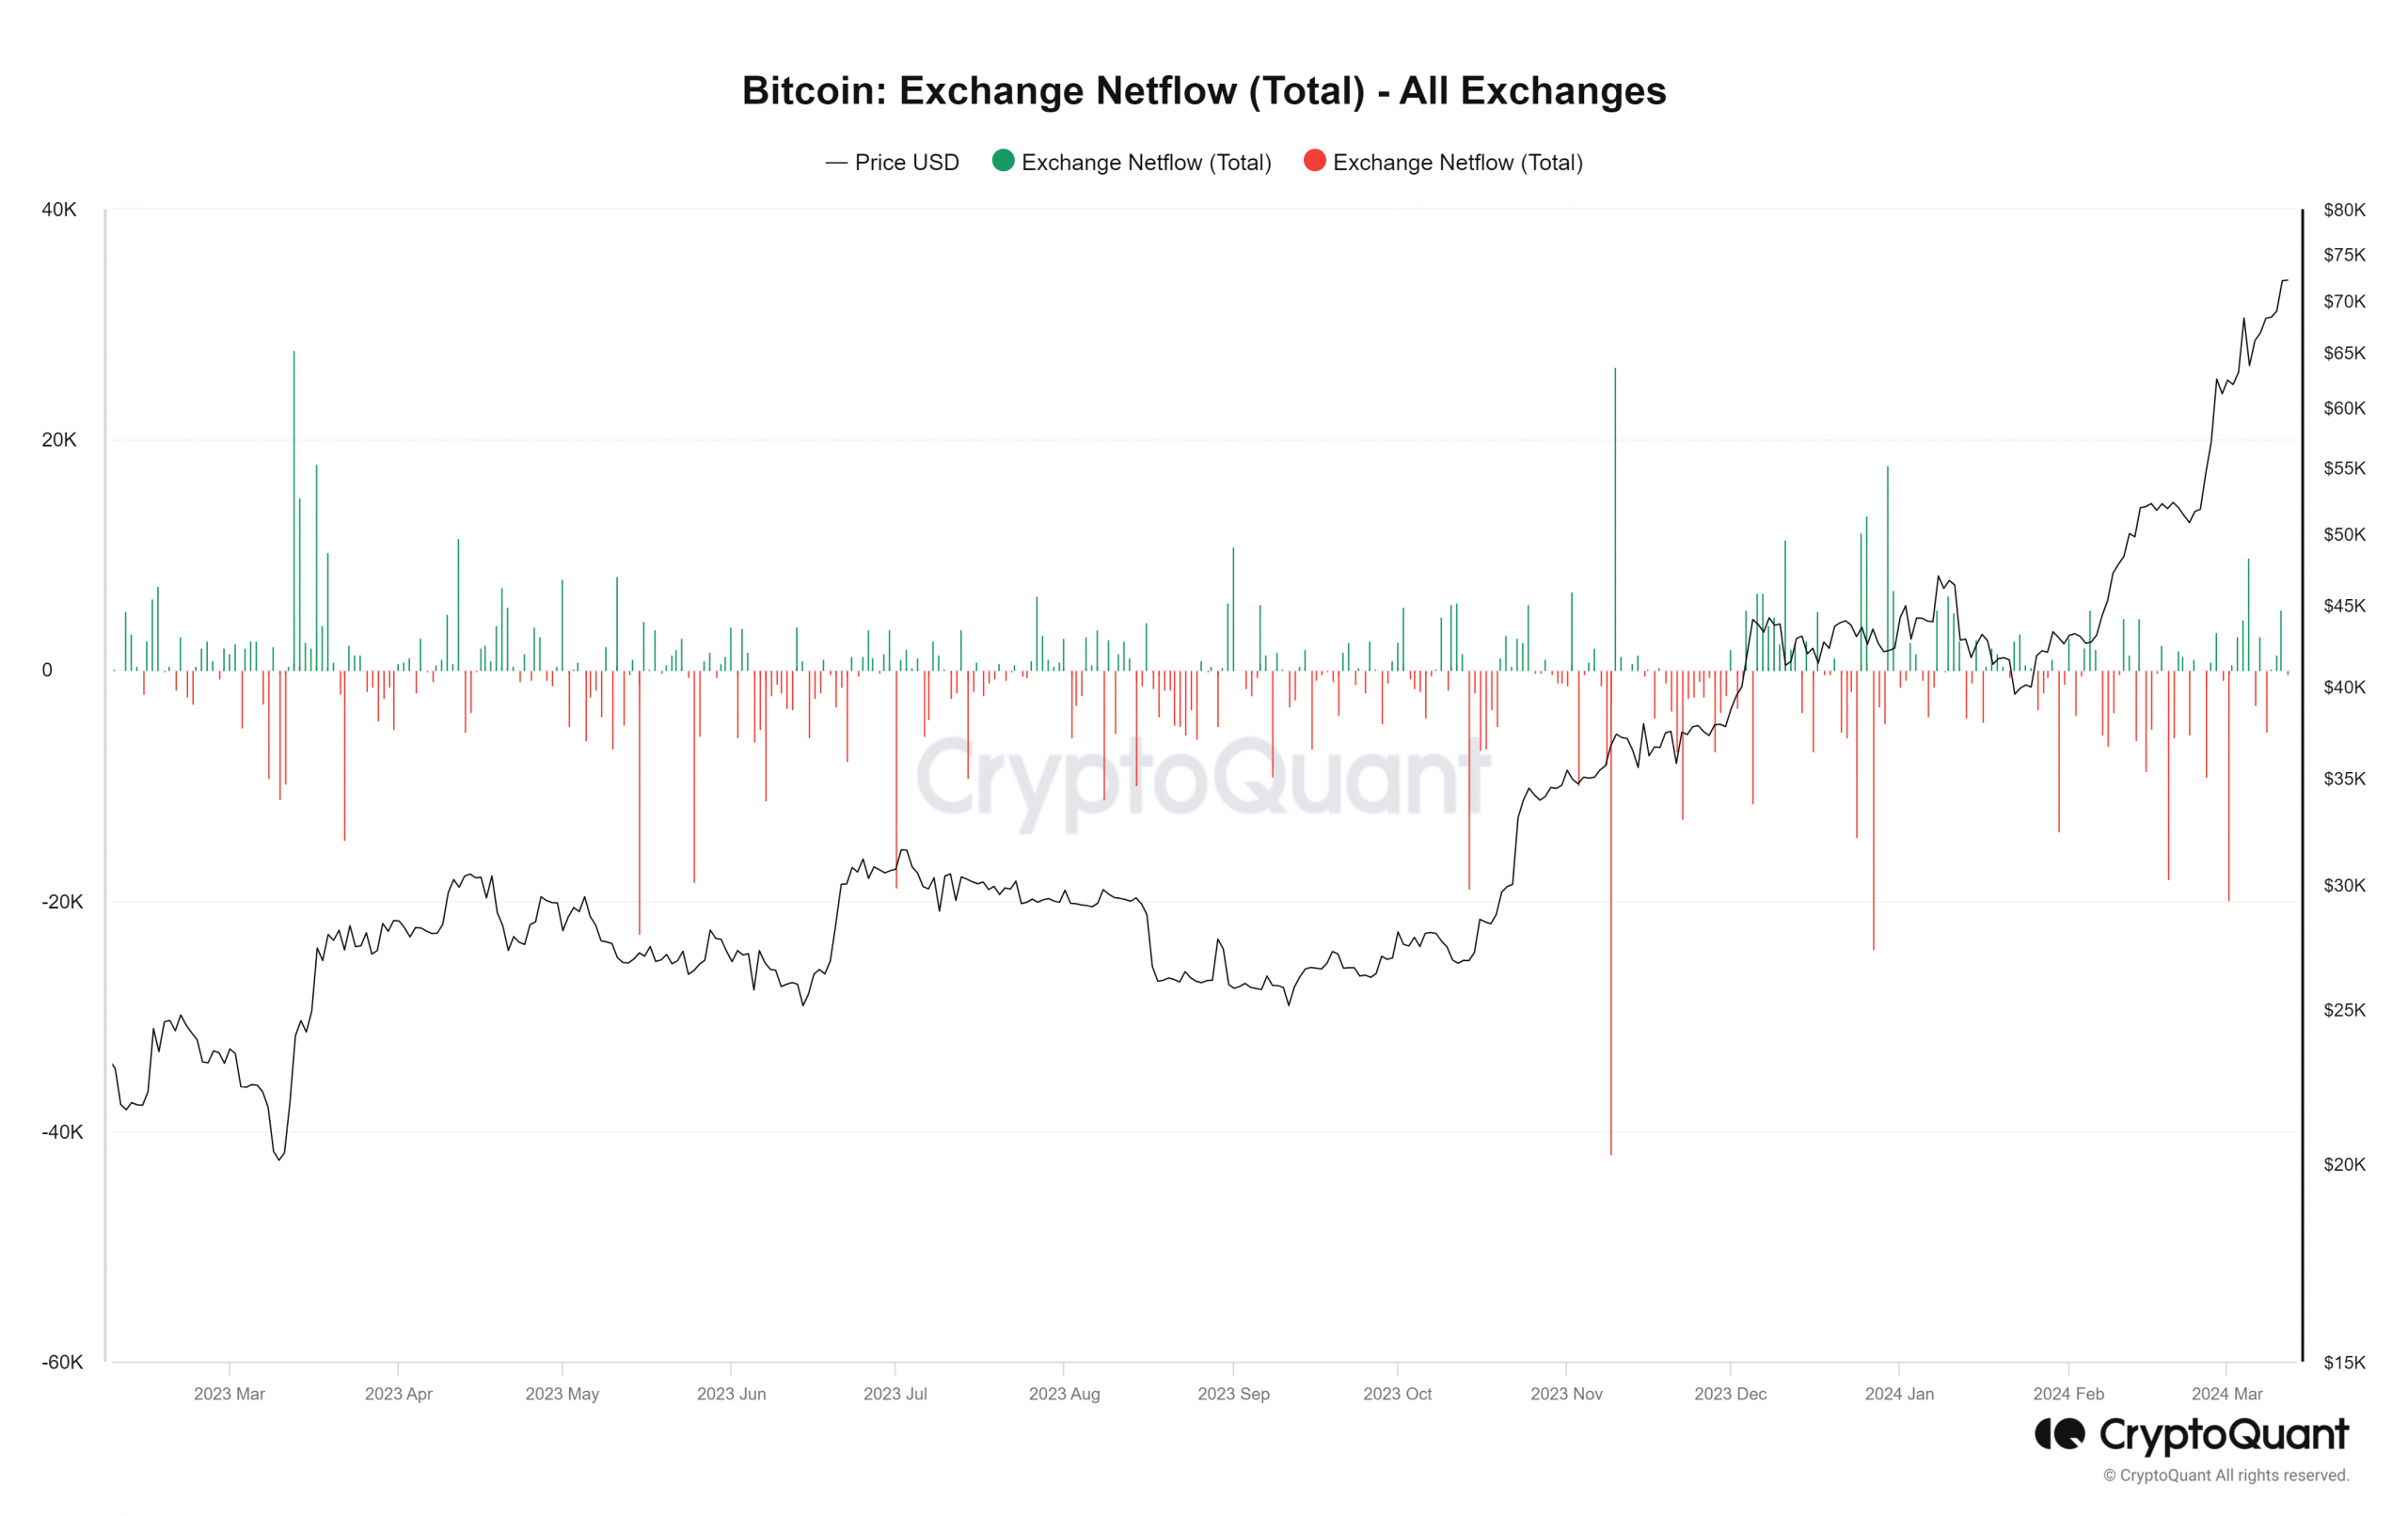
This prevalence of inflow implied that holders were depositing more Bitcoin onto exchanges than withdrawing, indicating a potential sell-off.
This development was not unexpected, considering the recent substantial rise in Bitcoin’s price.
BTC moving to new ATH
AMBCrypto’s examination of Bitcoin’s daily timeframe chart showed that it concluded trading on the 11th of March at around $71,401.
During that trading session, BTC’s price briefly surpassed $72,000 before experiencing a decline. This marked the first time in its history that it reached that price range, even if only momentarily.
At the time of this writing, Bitcoin was trading at about $71,850, reflecting a less than 1% increase.
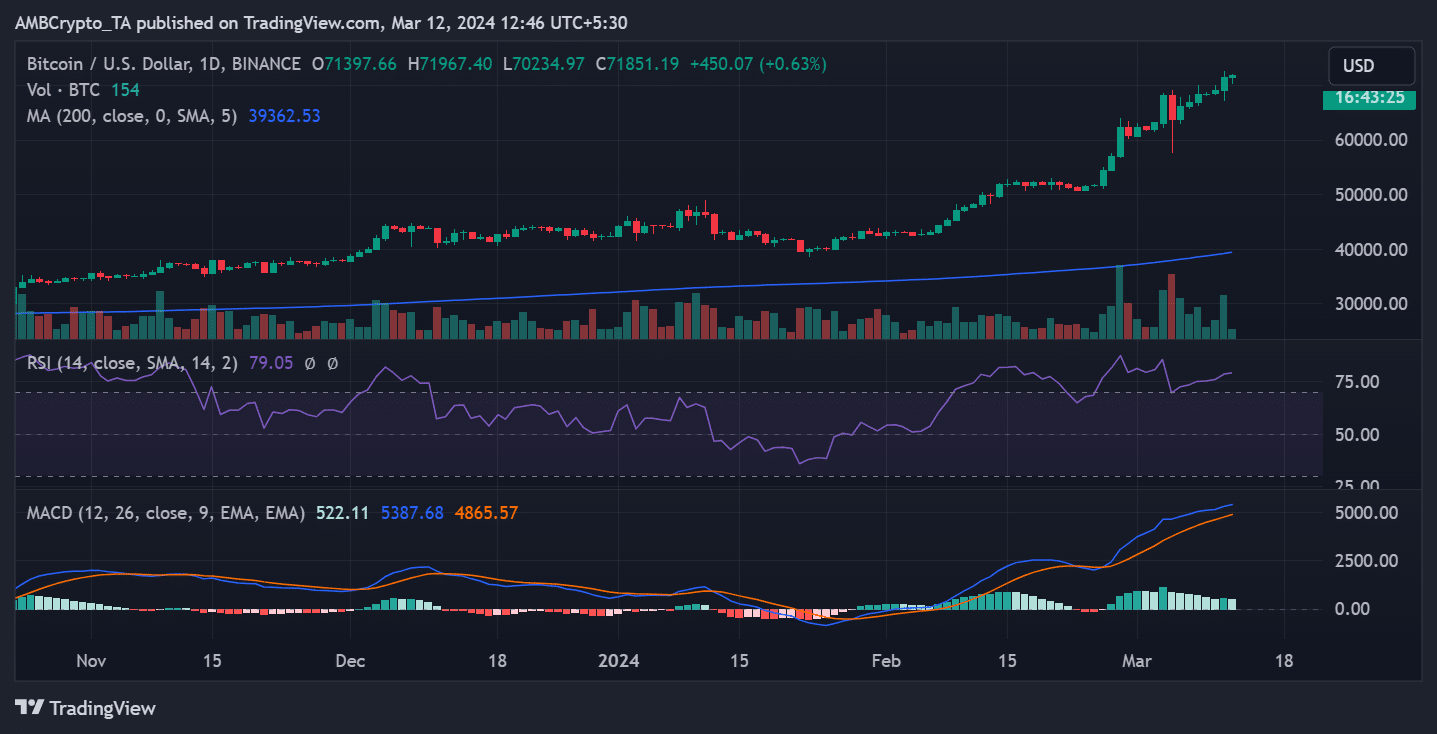
Furthermore, Bitcoin’s Relative Strength Index (RSI) demonstrated a convergence at press time. It was above 80, signaling both a strong bull trend and an overbought state for the king coin.


