MATIC holders, you have cause for concern IF…
MATIC may experience further downsides as bearish sentiment climbs.

- Technical indicators hinted at a further decline in MATIC’s price this week.
- Its price had fallen by double digits in the past two weeks.
Polygon’s governance token, MATIC, is poised to extend its weekly loss, as readings from its key indicators assessed on a 1-day chart hint at the possibility of a further price decline.
As of this writing, the Layer 2 (L2) token exchanged hands at $0.9. According to CoinMarketCap’s data, since MATIC rallied to a one-year high of $1.27 on the 14th of March, its value has declined by 25%.
MATIC is on the verge of further price decline
The decline in MATIC’s price, which began on the 15th of March, coincided with when its MACD line crossed below its signal line.
Resting below the zero line at press time, the position of the token’s MACD line showed that the market was rife with significant selling activity.
An asset’s market is said to be in a decline when its MACD line intersects its signal line in a downtrend and enters negative territory.
This means that the shorter-term moving average is below the longer-term moving average.
Traders often interpret this as a sign to exit long positions and occupy short ones, thereby putting downward pressure on an asset’s price.
Confirming the current bearish trend, MATIC’s Directional Movement Index (DMI) showed its positive directional index (green) resting below its negative index (red).
The red line also crossed above the red line on the 15th of March, confirming when the bears regained market control.
When these trend lines are positioned this way, it means that the bears’ power significantly exceeds that of the bulls, as the selling momentum is high.
Further, MATIC’s Aroon Up Line (orange) was 0% at the time of writing. This indicator measures an asset’s trend strength and potential reversal points.
When an asset’s Aroon Up line is close to zero, its most recent price high was reached long ago.
Read Polygon’s [MATIC] Price Prediction 2024-25
Signaling the decline in demand for MATIC by market participants, its Chaikin Money Flow (CMF) was -0.05 at the time of press. This indicator measures the flow of money into and out of an asset.
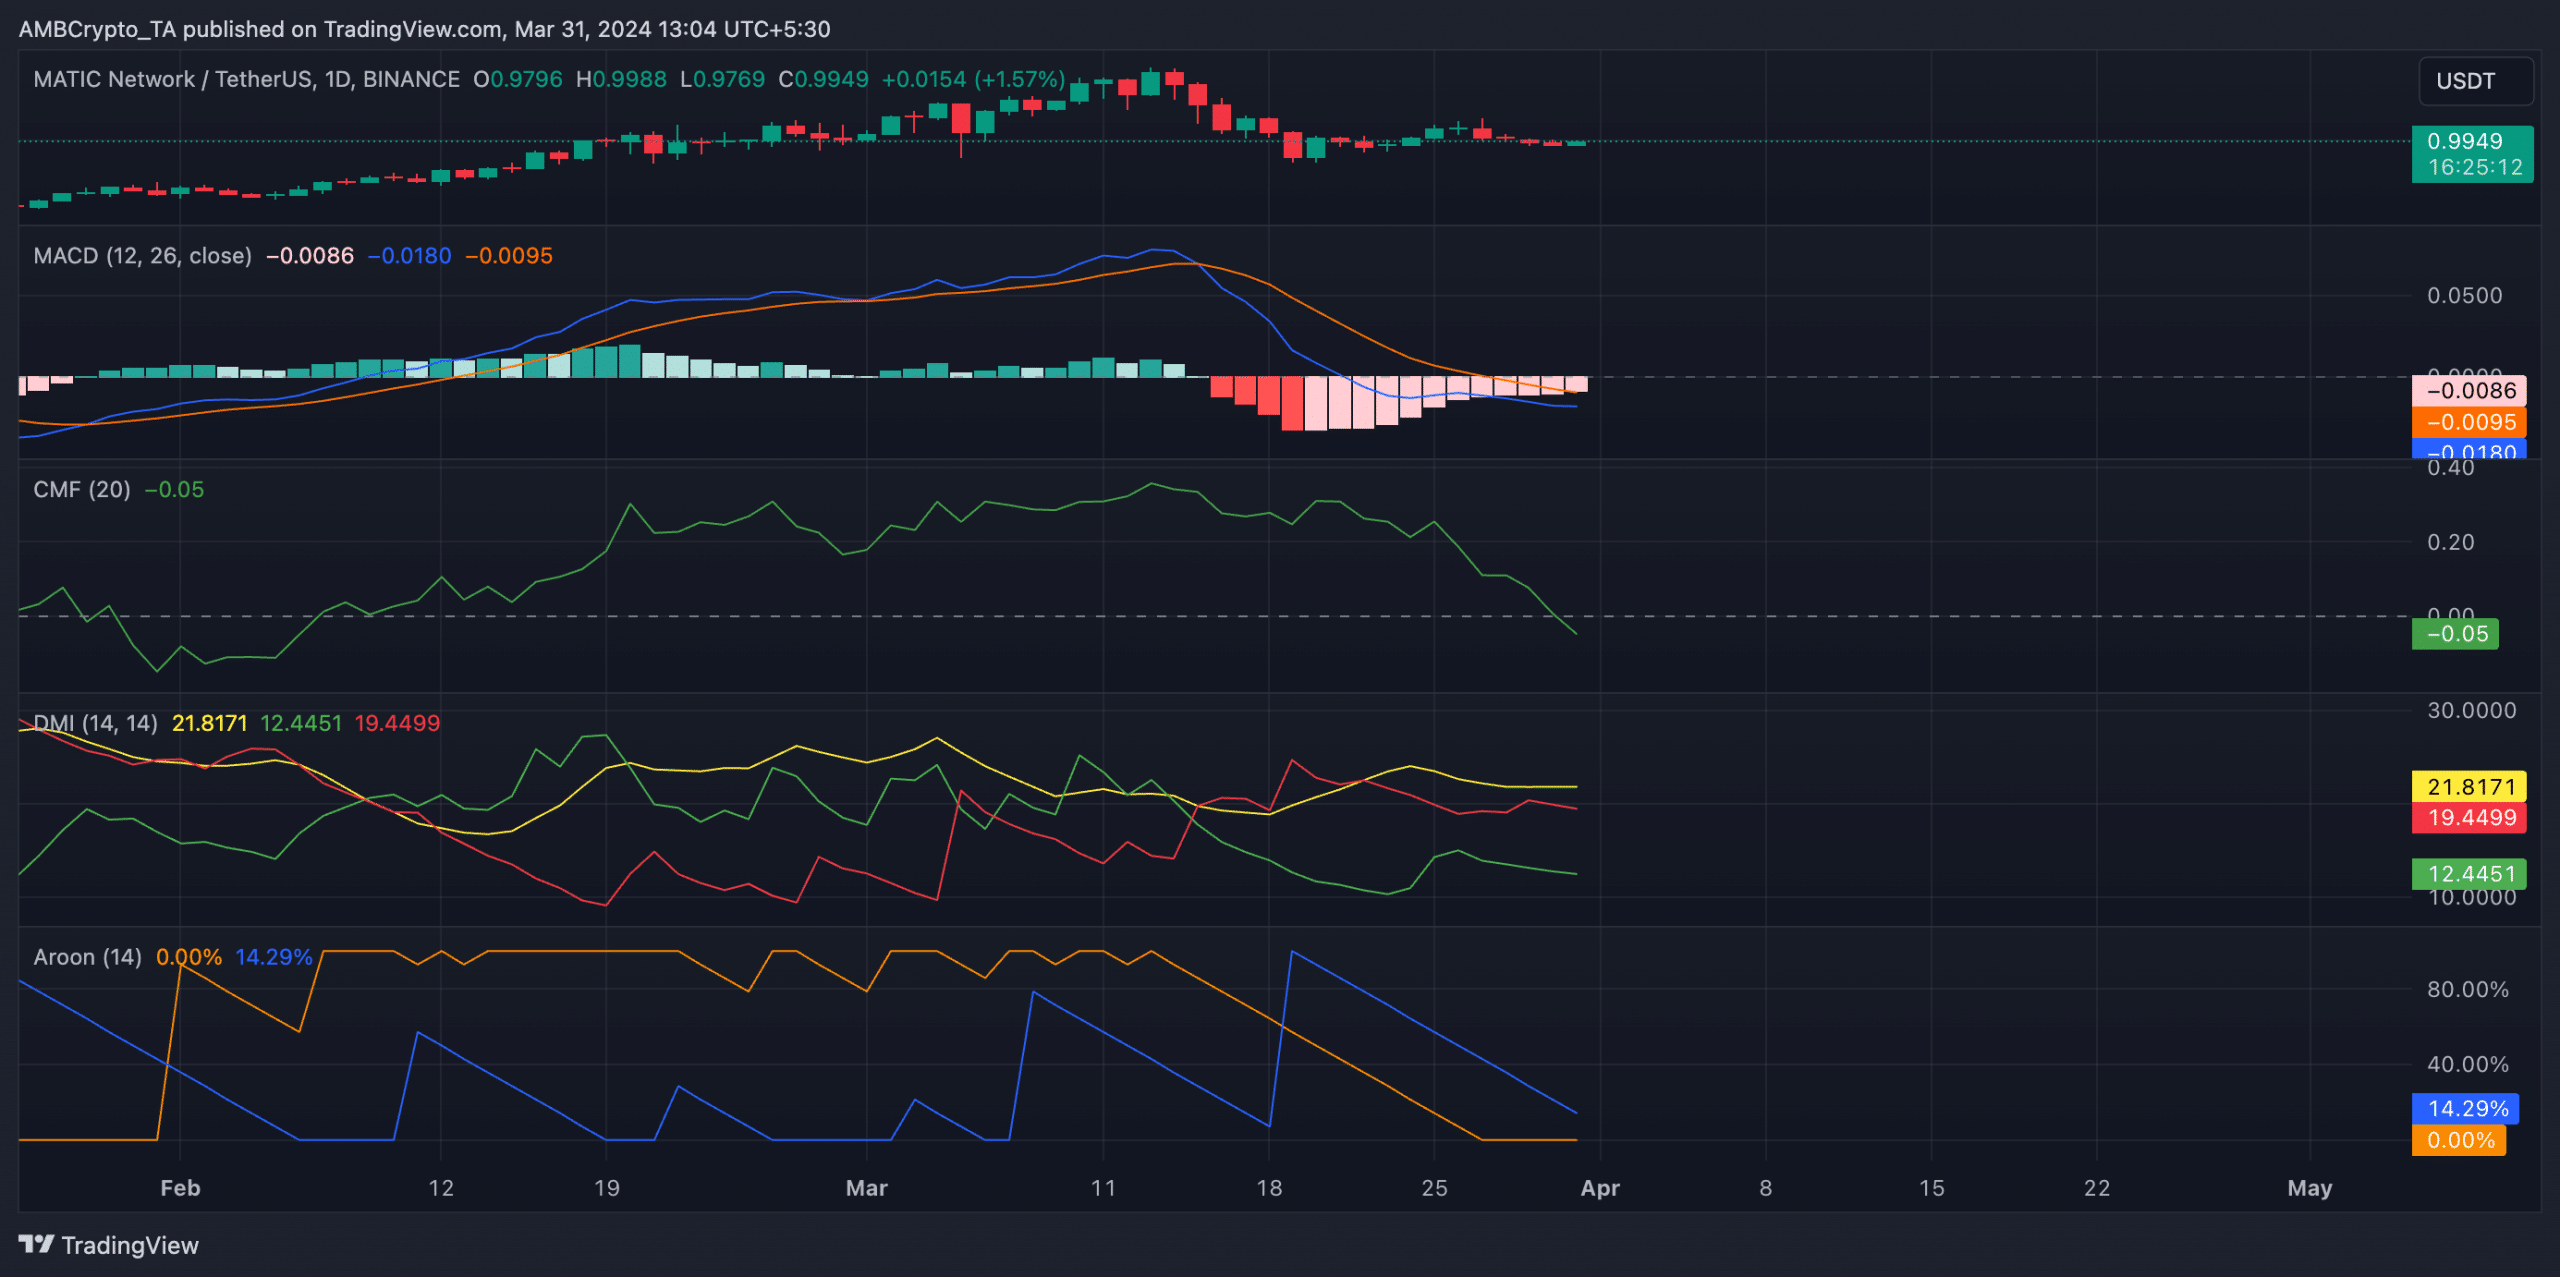
When its value is less than zero, it shows market weakness and a spike in coin distribution. It often precedes a decline in an asset’s price.


