Ethereum Classic [ETC] defends key support twice: $36 next?

- The liquidation heatmap suggested that a reversal might be imminent for ETC.
- The defense of the 78.6% retracement level encouraged bullish sentiment.
Ethereum Classic [ETC] showcased signs of long-term bullishness. Its volume indicator has trended upward since December 2023, signaling strong buying pressure.
On the other hand, the recent losses have strained investor confidence.
With Bitcoin [BTC] at $66k at press time, the short-term sentiment appeared to be in favor of the bulls. Yet, BTC also has significant resistance levels overhead, and another correction can not be ruled out.
Hence, ETC holders should also be prepared for a bearish scenario this summer.
Long-term ETC bulls remain confident
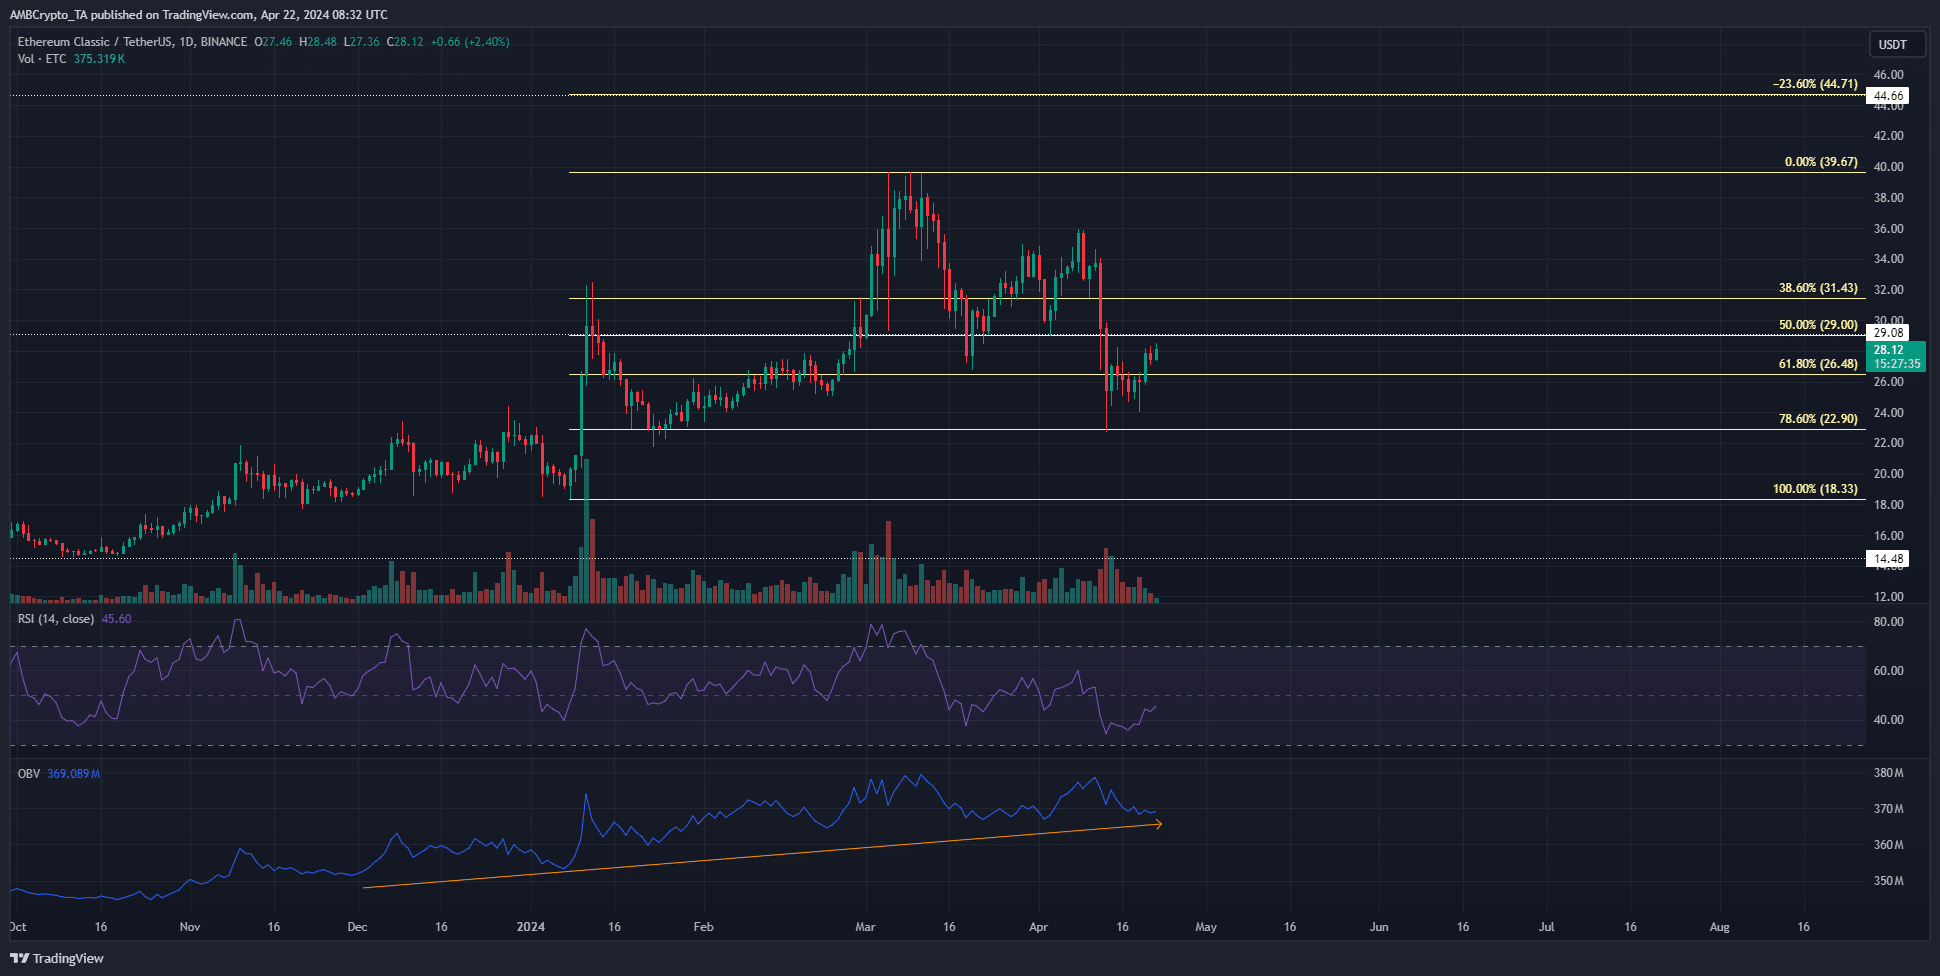
The Fibonacci retracement levels (pale yellow) showed that the 78.6% retracement level at $22.9 was defended twice in 2024.
Additionally, the higher timeframe market structure remained bullish, with $18.33 as the key swing low to beat.
The OBV has trended upward in the past five months, showcasing steady buying volume. Therefore, even though the recent pullback was intense, it is likely that the bulls will come out on top.
Conversely, since March, the OBV has struggled to set a new higher high.
Therefore, the buying volume was only slightly stronger in the past month. The buyers still have to fight to reclaim the short-term uptrend. The $29 and $34.4 are the next key levels for the bulls to claim as support.
The RSI remained below neutral 50 on the 1-day chart to signal bearish momentum persisted.
Intense resistance overhead — will we see a move southward soon?

Source: Hyblock
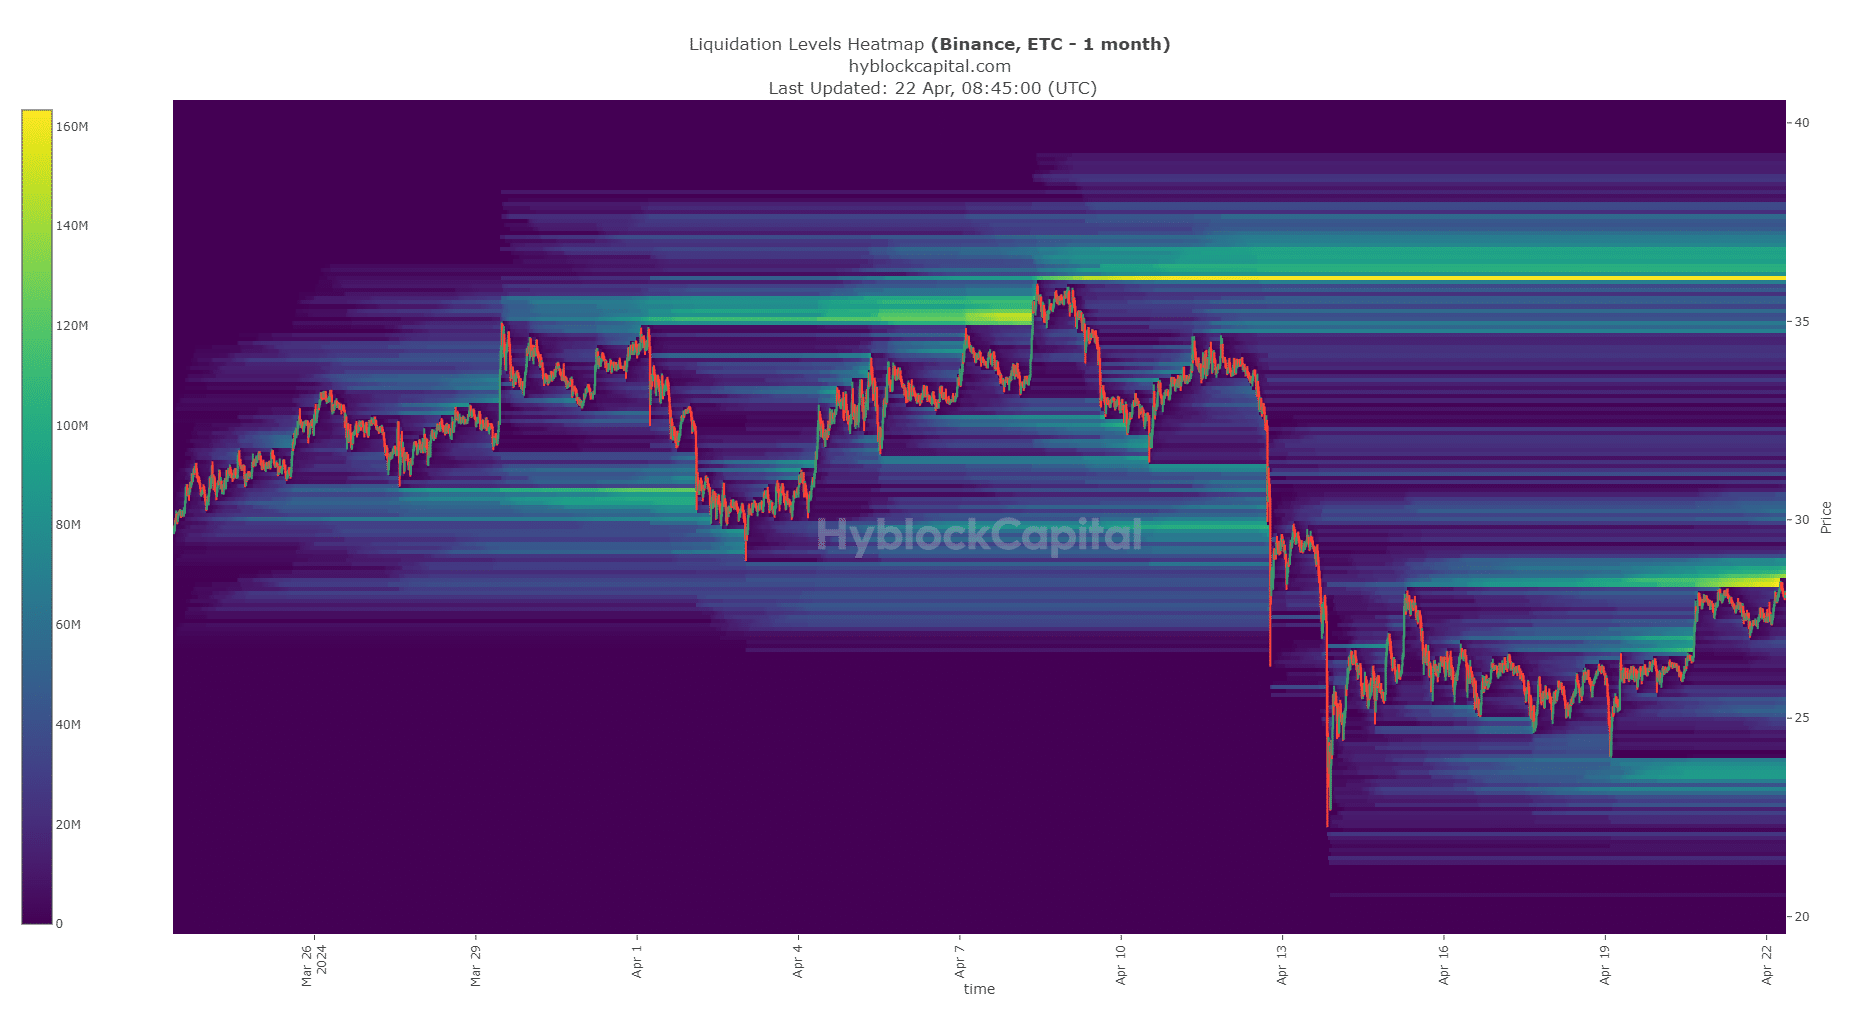
AMBCrypto analyzed the liquidation heatmap of the past month. It showed two intense pockets of liquidation levels at $28.47 and $36. At press time, the $28 region was tested.
Read Ethereum Classic’s [ETC] Price Prediction 2024-25
A sweep of the $28-$29 zone before a bearish reversal toward $23.6 remained a possibility.
To the north, the next large pocket of liquidity at $36 was quite far off. Unless demand arrives and sentiment shifts bullishly in the near term, traders should be prepared for a rejection from the $29 resistance region.
Disclaimer: The information presented does not constitute financial, investment, trading, or other types of advice and is solely the writer’s opinion.


