Bitcoin dominance falls: Time to stock up altcoins like LINK now?
A large spike in CDD implies long-dormant Bitcoin was moved, with the most recent spike occurring on the 24th of April.

- Bitcoin dominance and a technical indicator suggested it might be time for swing traders to look at altcoins.
- Relative strength against BTC is an important factor alongside long-term support zones to gauge underperforming altcoins.
Bitcoin [BTC] was trading inside a range within a range. With a short-term bearish bias, Bitcoin and the rest of the crypto market were not attractive to long-term investors.
The market could take a few weeks to consolidate, especially considering the massive gains in the months leading to the halving. This might present a buying opportunity for altcoins that showed strength.
Examining the recent BTC reset
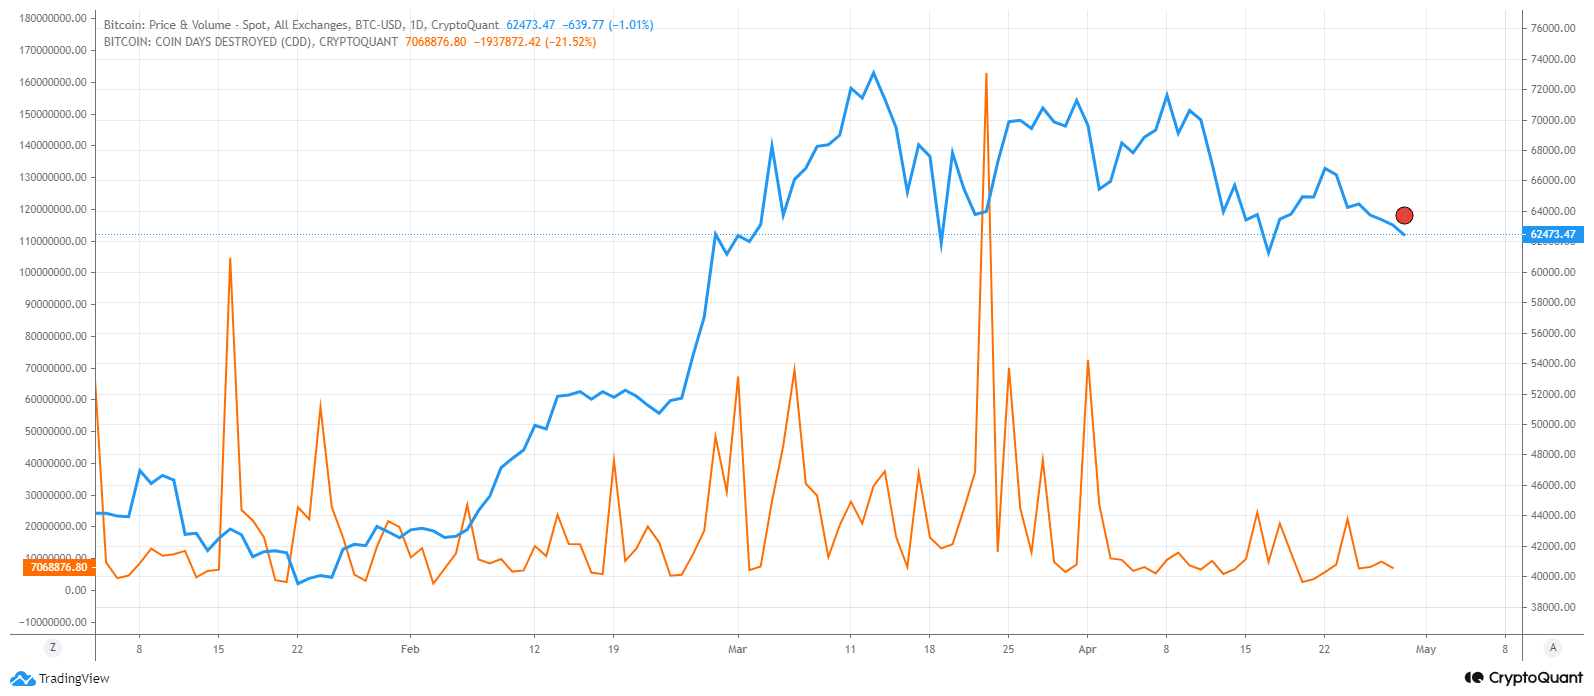
Coin days destroyed (CDD) is a metric that measures the age of the coins moved during a transaction. It is calculated by multiplying the number of coins in a transaction by the number of days the coin has not moved.
Hence, a large spike in CDD implies that long-dormant Bitcoin was moved. Long-term holders might choose to book profits during a rally (like it did on the 23rd of March), or after a particularly deep pullback (the 1st of April).
While it is not a crystal ball, it is a useful metric to gauge the HODLer sentiment.
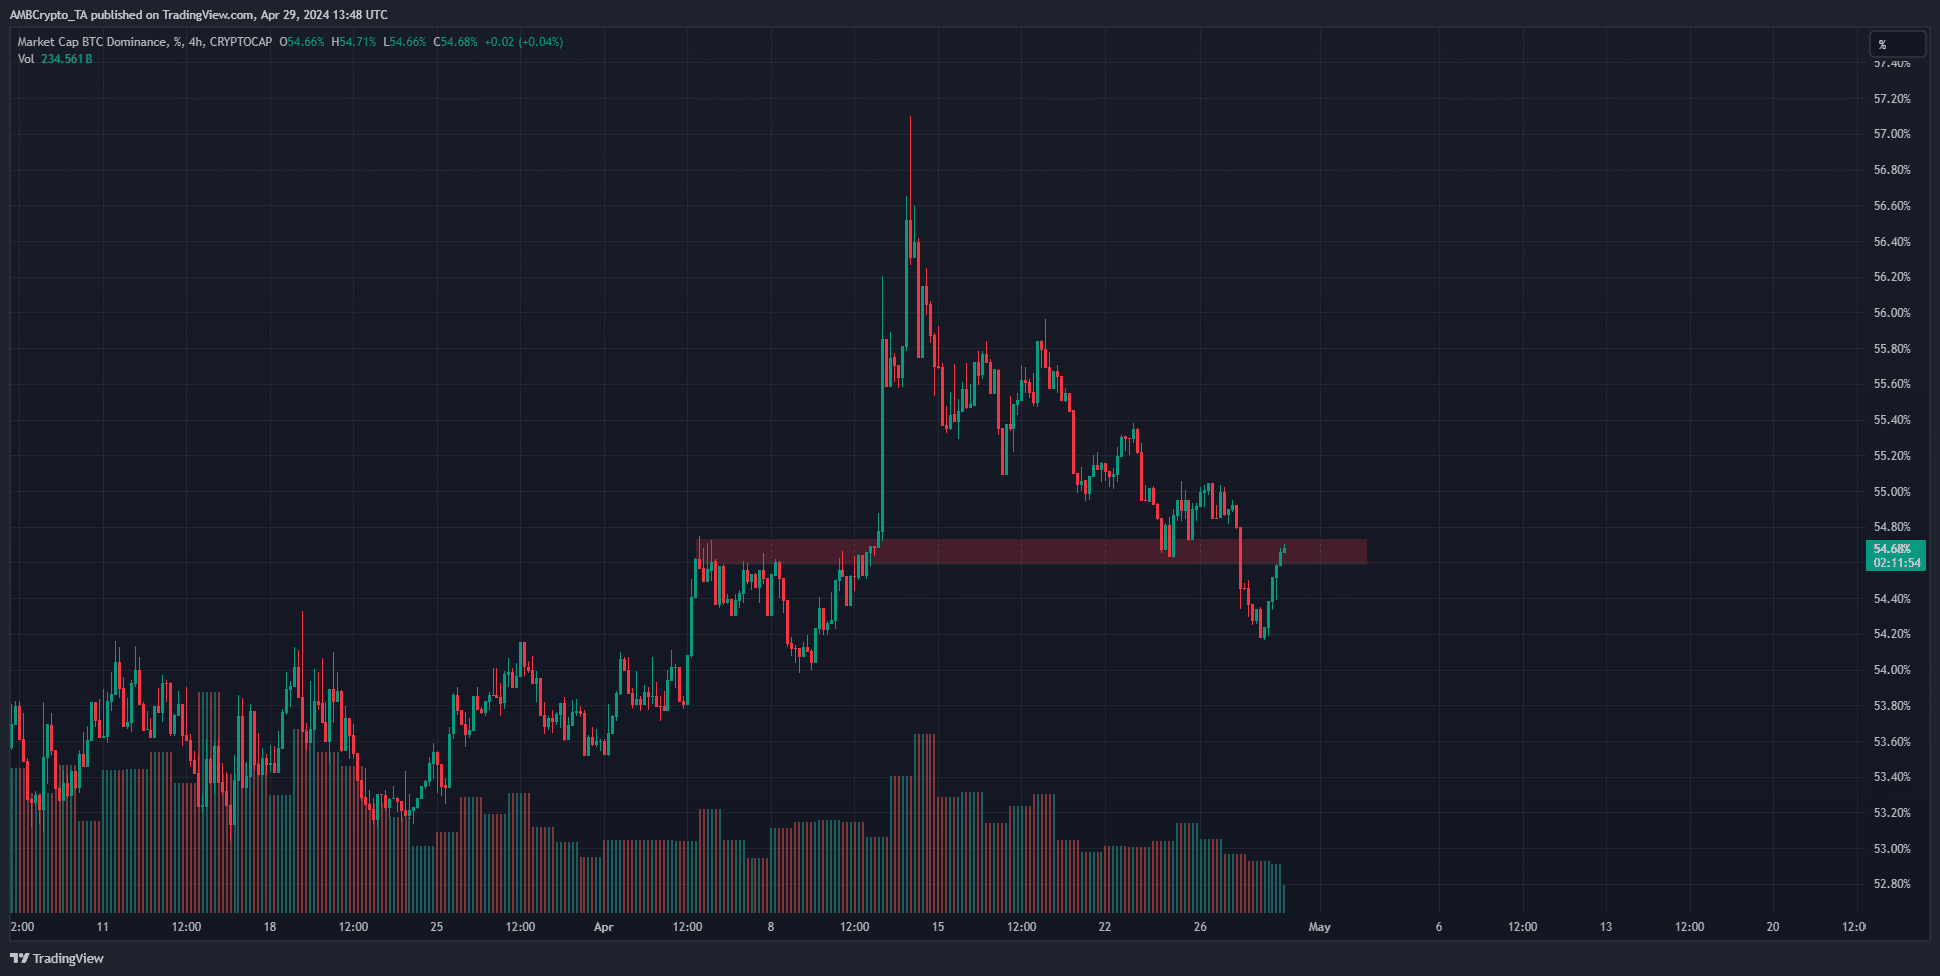
The Bitcoin Dominance chart measures the market capitalization of BTC as a percentage of the total crypto market capitalization. It stood at 54.68% at press time and has fallen beneath a former support level.
This zone, highlighted in red, is expected to serve as resistance. Therefore, if the BTC’s dominance resumed its downtrend, it could give altcoins a chance to make gains.
Which altcoin could you focus on?
In a recent post on X, crypto analyst Ali Martinez noted that the TD Sequential Indicator flashed a buy signal for Chainlink [LINK] on the 12-hour chart. Yet, LINK has lost close to 33% since the 26th of March.
In the same period, Bitcoin has lost 12.2%. A sign of strength in an altcoin is when it holds up reasonably well against BTC losses. LINK did not exhibit strength against Bitcoin in the past month.
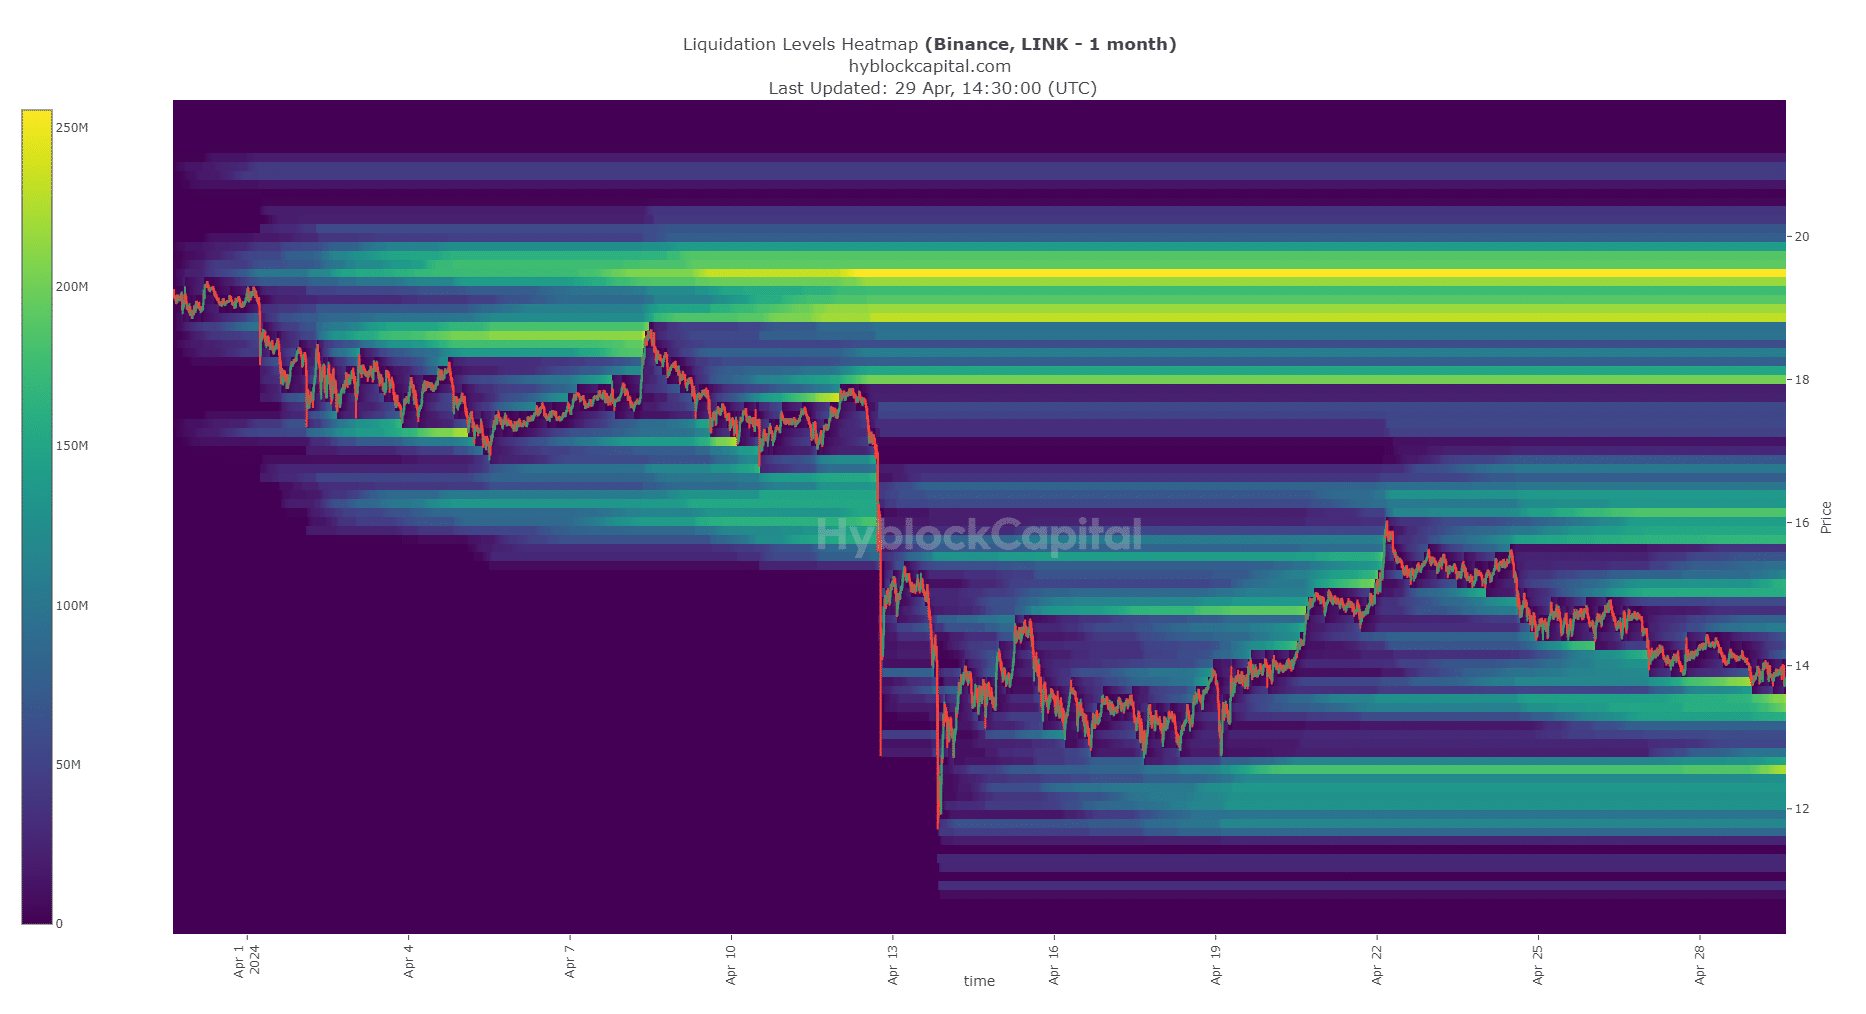
The liquidation heatmap showed that $16, $18 and $19.5 were the regions with the highest concentration of liquidation levels to the north. This marked them as bullish targets. However, the downtrend was still in play.
Is your portfolio green? Check the Chainlink Profit Calculator
The liquidity at $13.5 and $12.5 was much closer and more likely for LINK prices to reach in the coming weeks.
Therefore, even though BTC Dominance and the TD sequential gave swing traders a reason to go long, the potential for a drop to these support levels must be kept in mind before entering trade positions.


