Cardano’s resistance at key level: ADA to $1… finally?
ADA's Open Interest fell from $317 million to $157 million, and has remained unmoved.
![Cardano's [ADA] resistance at key level: Can bulls finally turn things around?](https://ambcrypto.com/wp-content/uploads/2024/05/Cardano-Featured-Image.webp)
- Cardano flipped the HTF structure bearishly.
- The CMF indicator showed that buyers might be able to force a recovery.
Cardano [ADA] ranged between the $0.68 and $0.447 levels. It has traded within this range since January. A breakout was successful in the first week of March, but the sellers quickly forced prices within the range.
AMBCrypto noted that the market structure was bearish and that the Fibonacci levels projected a bearish target for traders. Will we see this dip, or will the range lows see an increased demand this time?
An argument for why the range lows might be flipped to resistance soon
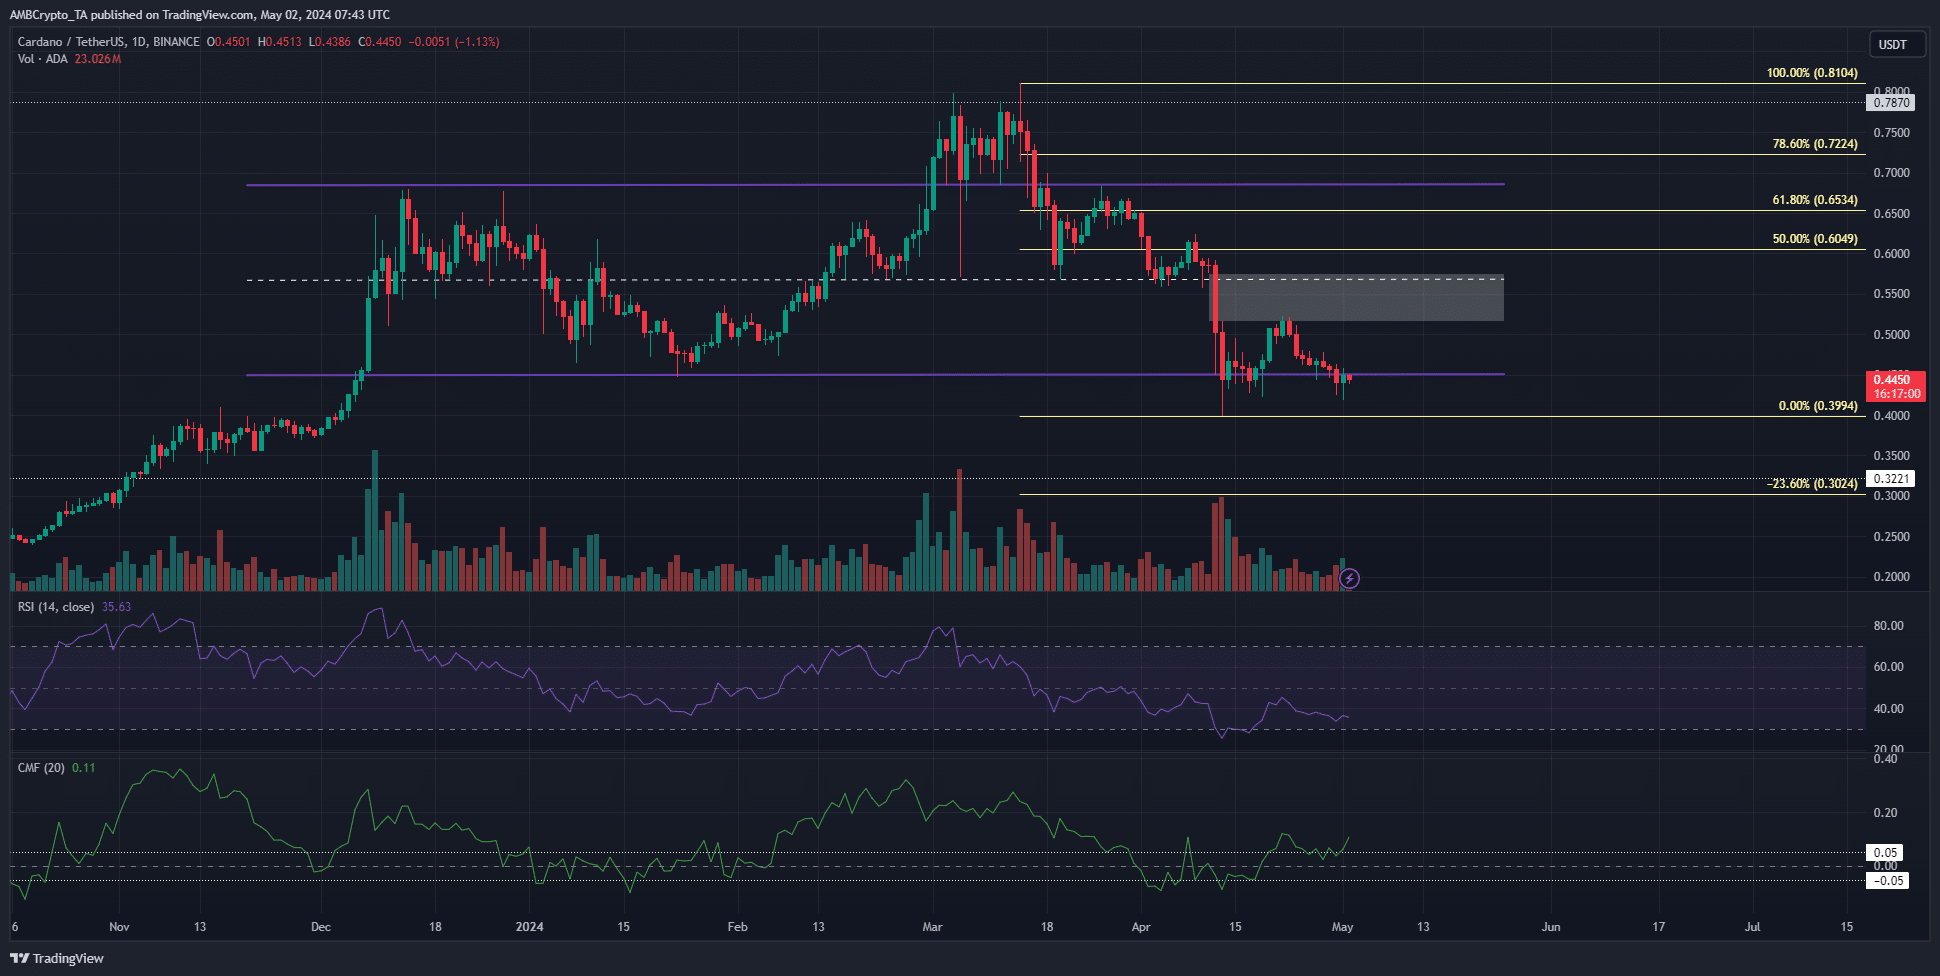
The price was at the range lows once again. In the past month, it has closed multiple daily sessions below the range low at $0.447, which meant that a move further south is expected.
The market structure on the daily chart was bearish. Additionally, the fair value gap (white box) at $0.52 was tested and rejected the bulls’ attempts at recovery.
Combined with the 1-day RSI reading of 35, it was likely that another move downward would soon arrive.
Surprisingly, the CMF indicator was at +0.11 to show sizeable buying pressure in the market. It flew against the findings from the rest of the technical analysis.
The 23.6% Fibonacci extension level at $0.3 and the HTF $0.32 level are the next areas of interest for a potential bullish reversal.
This downtrend needs to halt before bulls stand a chance
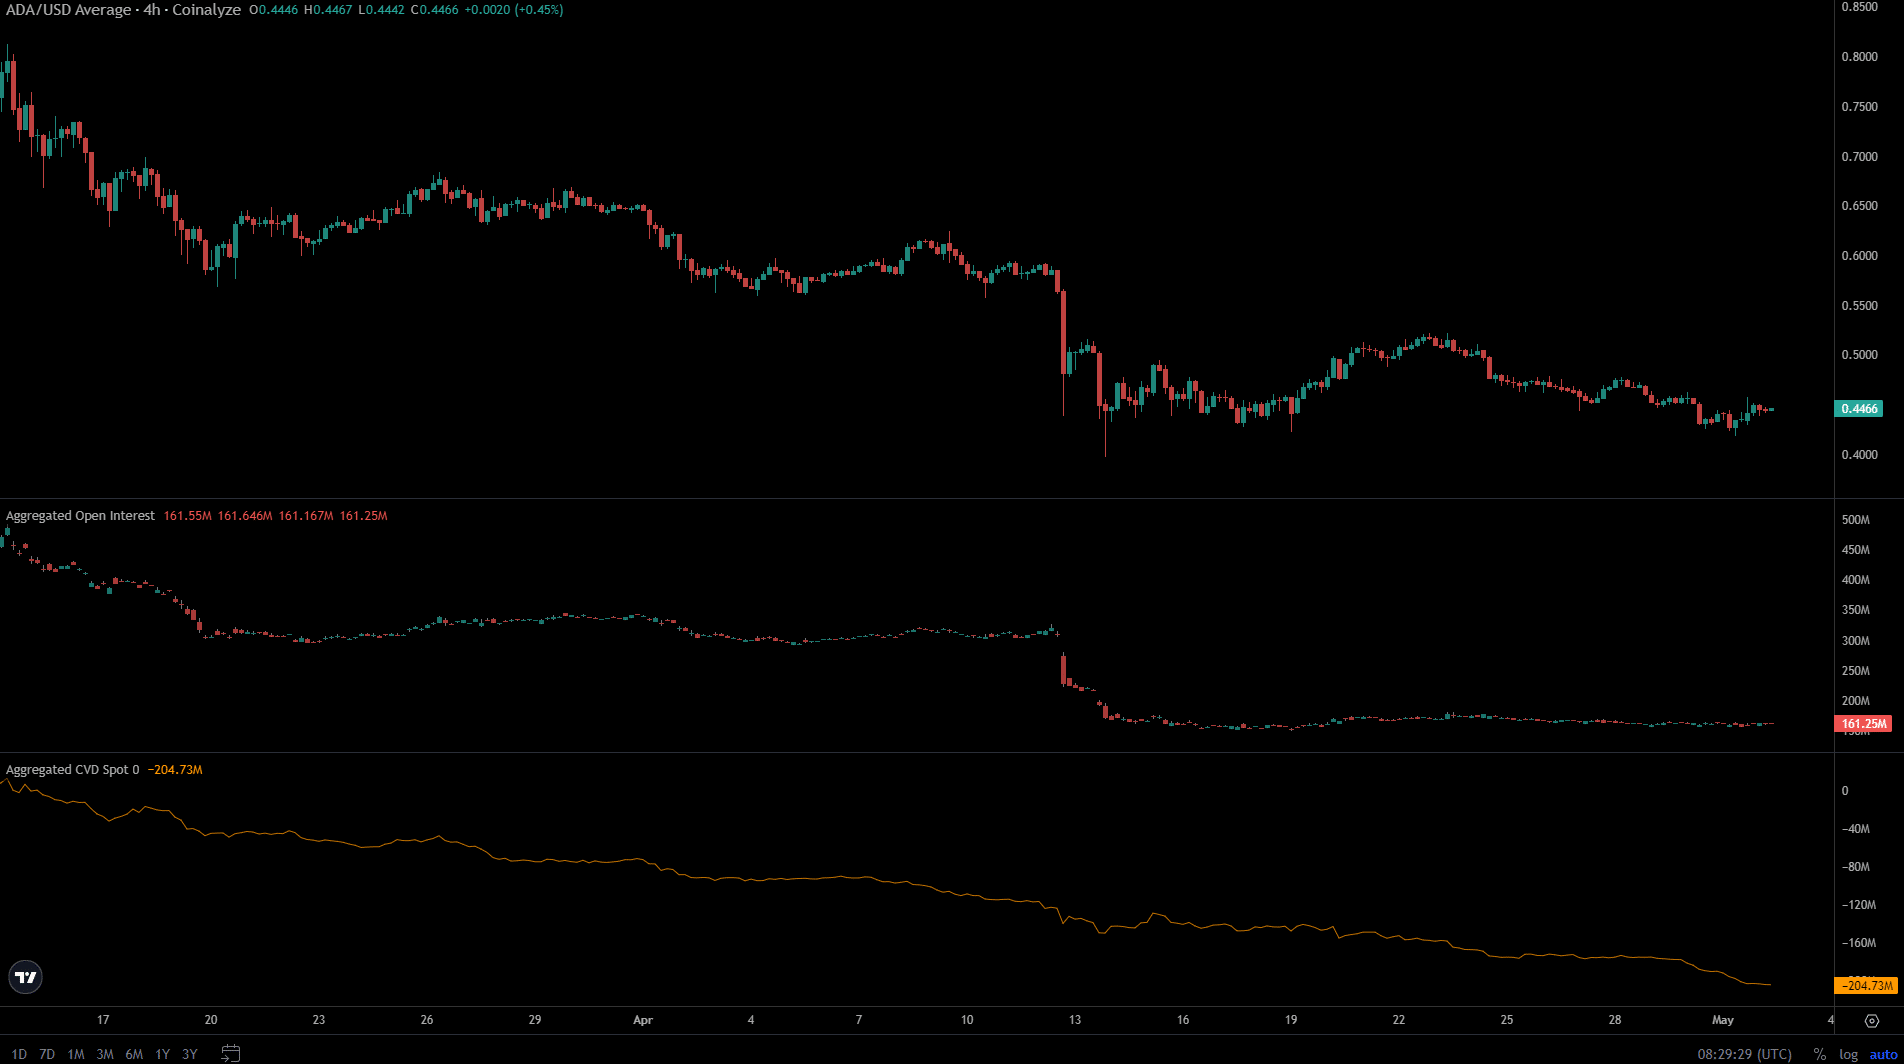
The Open Interest fell from $317 million on the 12th of April to $157 million on the 18th of April. Since then, the OI has remained stagnant, with a value of $161.25 million at press time.
This showed a lack of speculative activity and bearish sentiment.
Is your portfolio green? Check out the ADA Profit Calculator
The spot CVD highlighted the lack of demand in the spot market. It has trended downward throughout April. This indicator needs to begin to move sideways to signal the end of the immense selling pressure.
Until it does, we can expect prices to slowly bleed and descend.
Disclaimer: The information presented does not constitute financial, investment, trading, or other types of advice and is solely the writer’s opinion.