Ethereum price prediction: ETH crosses $3.1K, another 50% gain next?
Ethereum can break out from its falling wedge pattern soon - Is this a sign of a bull rally, or something else?

- Metrics suggested that Ethereum was undervalued.
- Market indicators gave ambiguous signals regarding an upcoming bull rally.
Ethereum [ETH] came back on track on the 6th of May as its price once again crossed $3.1k. While the token crossed the psychological resistance, it also consolidated inside a bull pattern.
A breakout above the pattern could allow ETH to reach new highs in the coming weeks.
Ethereum price prediction
Last week was not in investors’ best interest as the king of altcoins’ price plummeted to $2.8k. However, the token gained bullish momentum on the 1st of May as its price moved up steadily.
According to CoinMarketCap, ETH’s price increased by over 1.55% in the last 24 hours. At press time, it was trading at $3,144.11 with a market capitalization of over $377 billion.
In the meantime, World of Charts, a popular crypto analyst, recently posted a tweet highlighting a falling edge pattern on ETH’s chart.
The token started to consolidate inside the pattern since the beginning of March. As per the tweet, the correction phase for ETH was over as it was headed towards the upper trendline of the falling wedge.
A successful breakout from the falling wedge pattern could lead to a 45%-50% price rise in the coming weeks. Predicting Ethereum’s price, it might as well surpass its March high if a bull rally happens.
Is Ethereum ready for a rally?
AMBCrypto then analyzed Ethereum’s on-chain metrics to see whether they supported the possibility of a breakout.
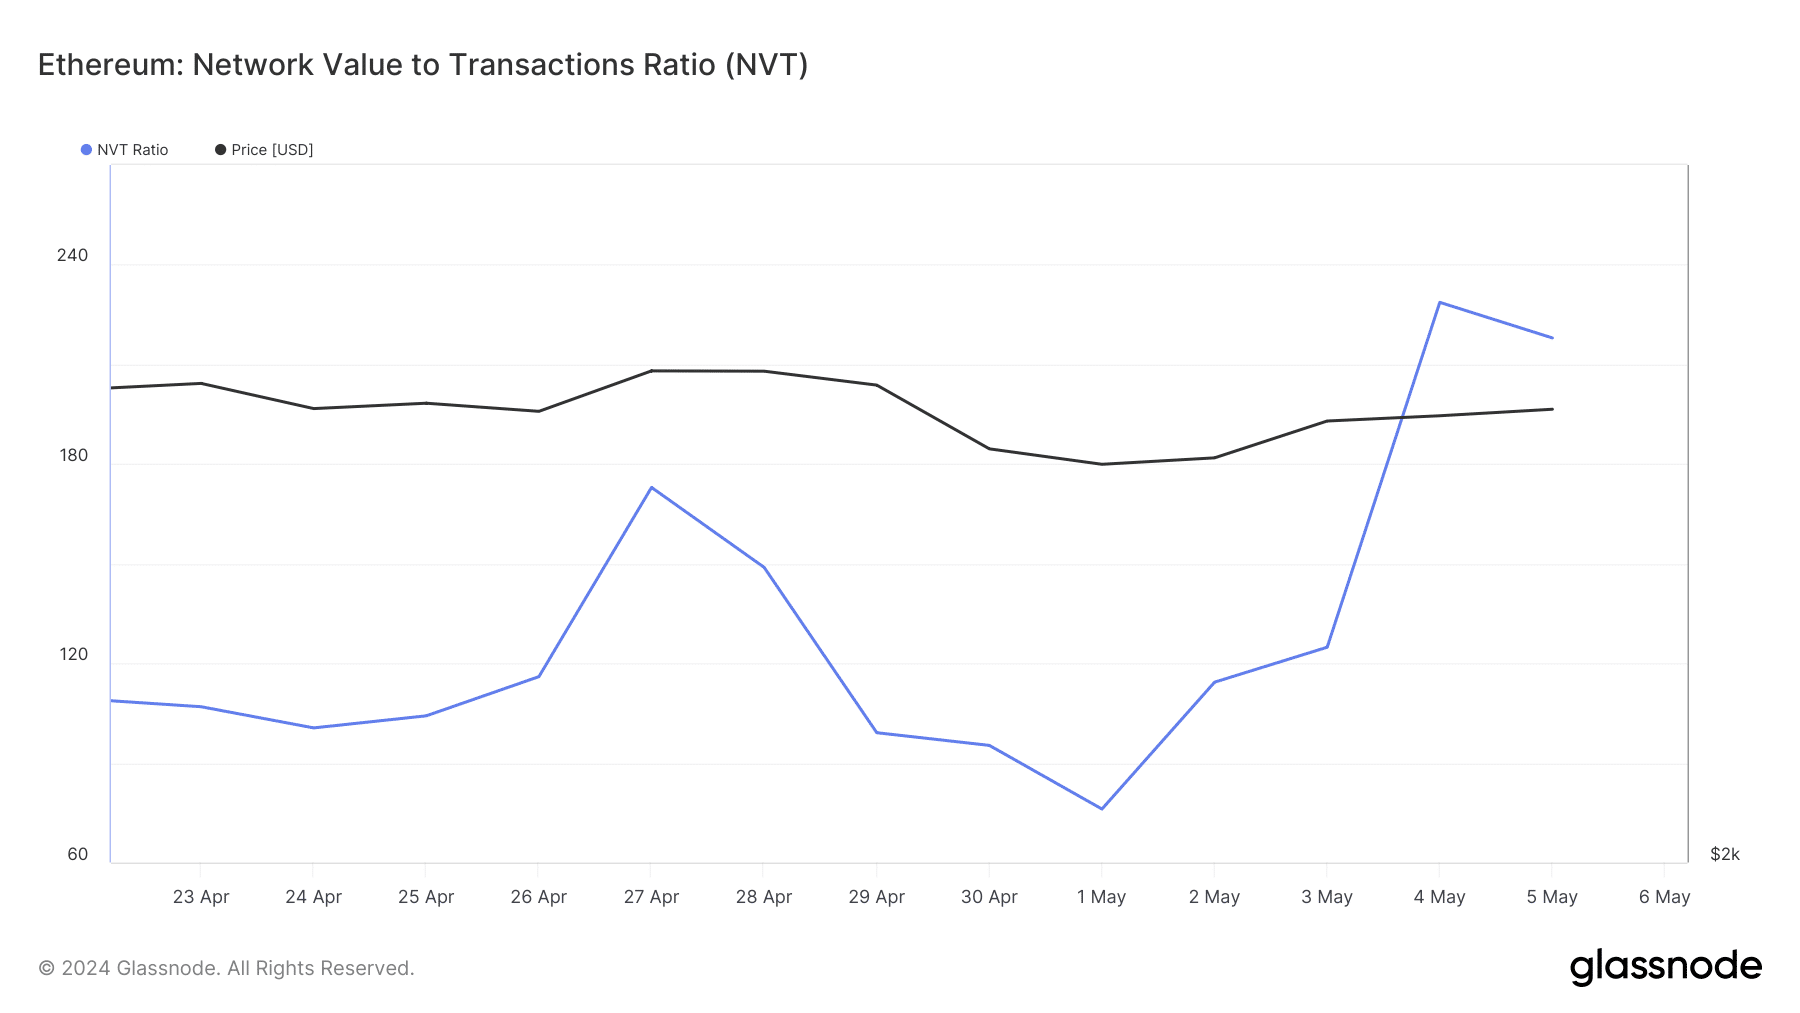
Notably, ETH’s Network To Value (NVT) ratio registered a downtick after a sharp increase. A drop in the metric means that an asset is undervalued.
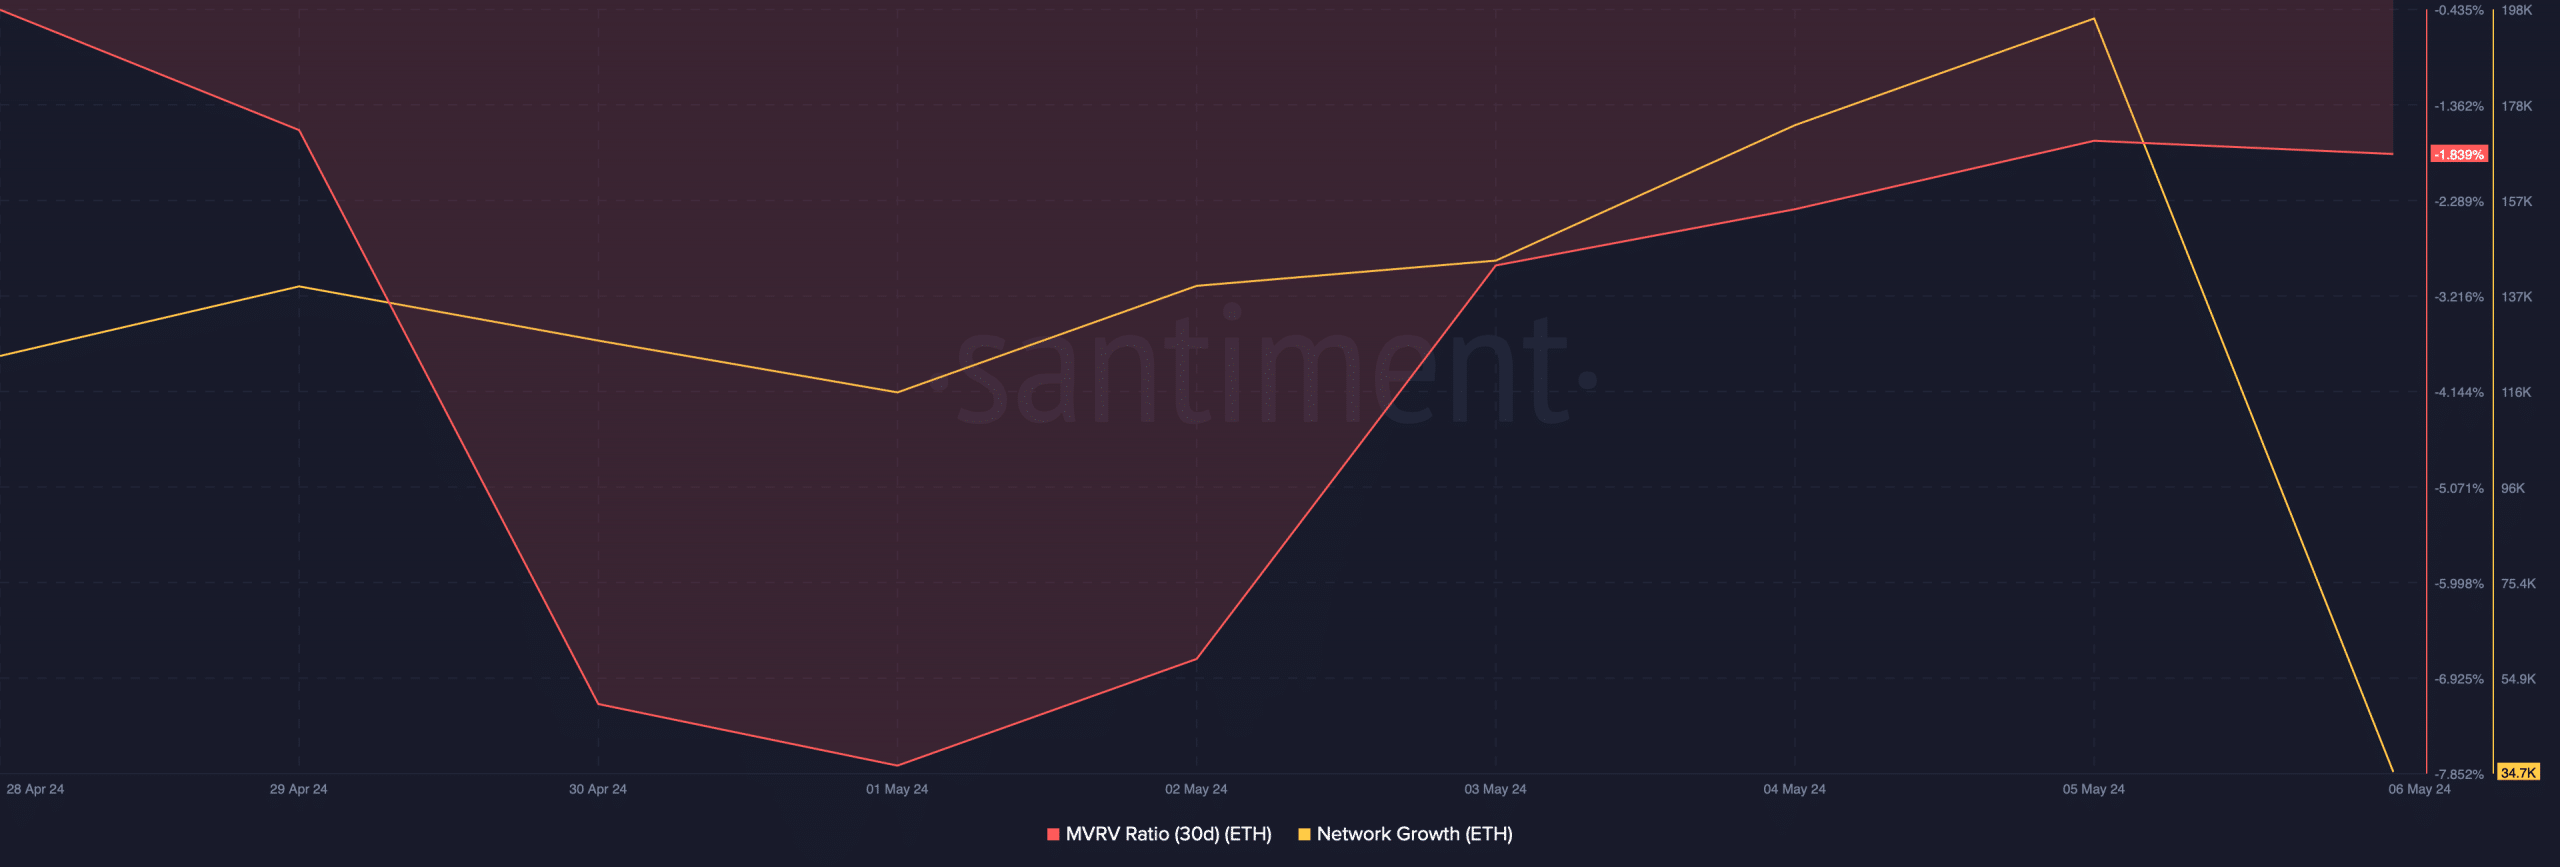
Our analysis of Santiment’s data pointed out a few other bullish metrics. For instance, ETH’s MVRV ratio improved over the last week. Its Network Growth was also high.
This meant that more new addresses were created to transfer the token, reflecting high activity.
However, Lookonchain’s latest tweet pointed towards a sell-off. As per the tweet, a whale sold 7k ETH, which, at press time, was worth over $22 million, according to AMBCrypto Converter.
This seemed bearish, as it hinted that the whale was expecting a price drop.
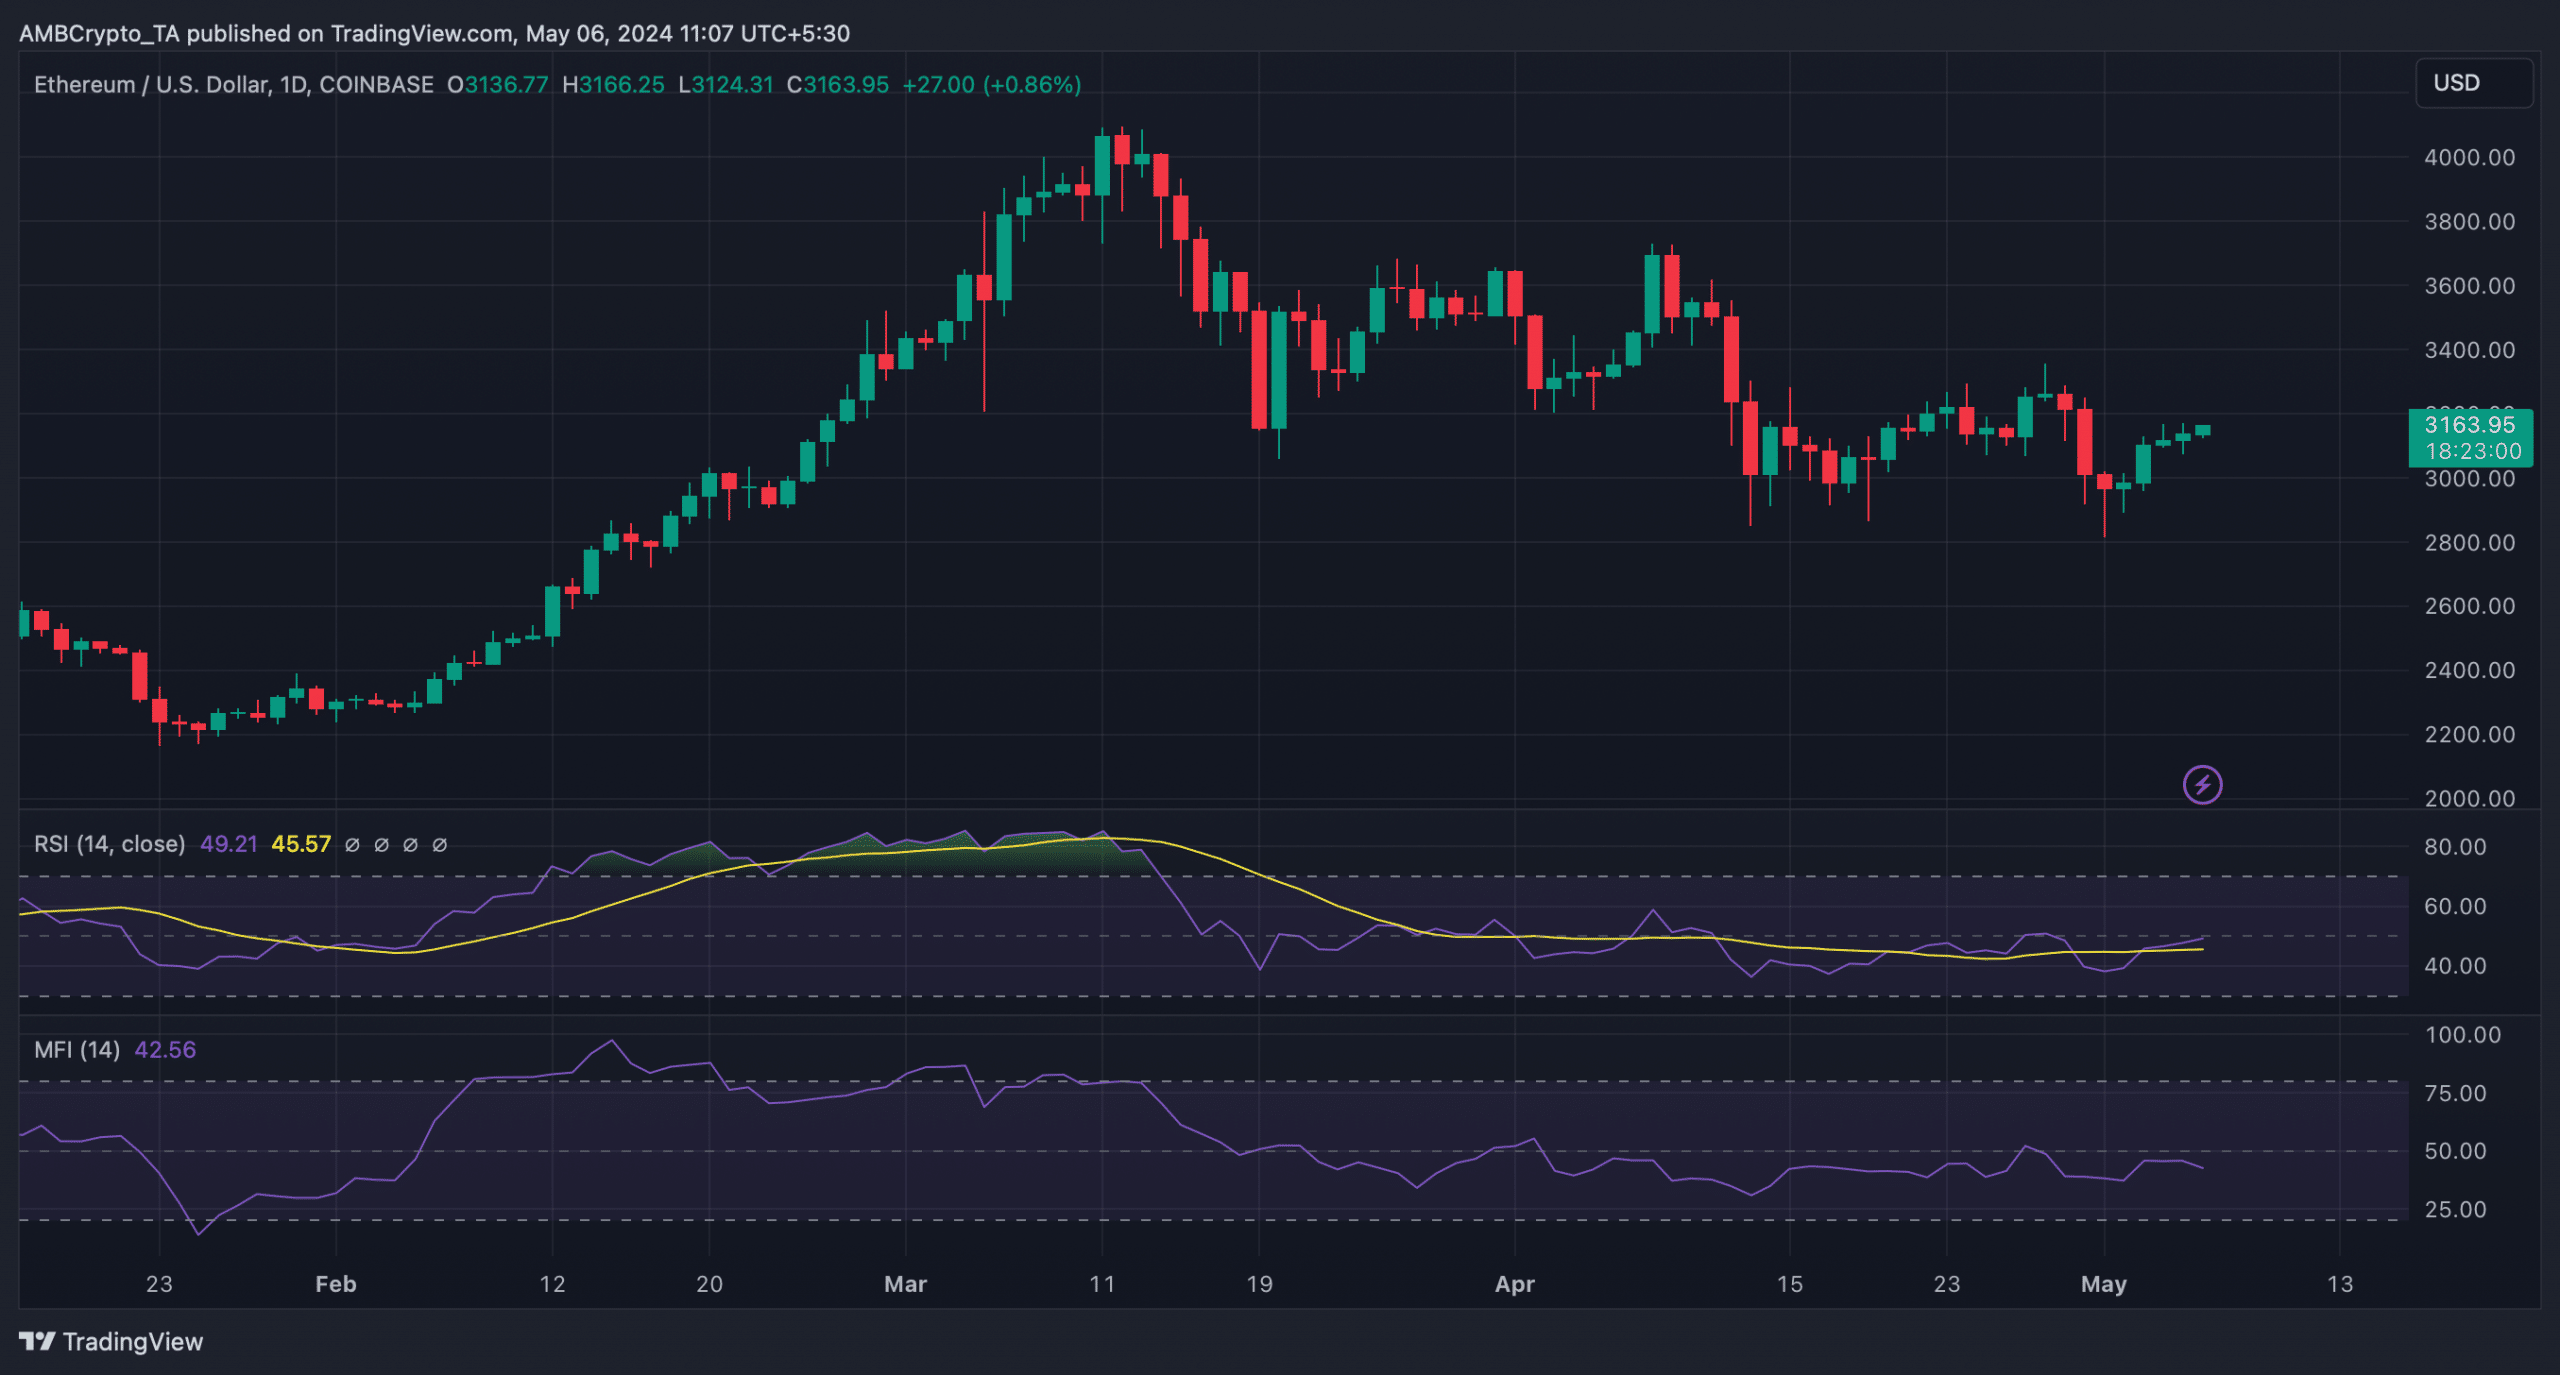
To better understand whether a breakout above the falling wedge pattern was possible, AMBCrypto then analyzed ETH’s daily chart.
Read Ethereum’s [ETH] Price Prediction 2024-25
As per our analysis, ETH’s Relative Strength Index (RSI) registered an uptick and had a value of 49.7, suggesting that the chances of an upward price movement were high.
Nonetheless, the Money Flow Index (MFI) supported the bears as it was resting below the neutral mark of 50.