Monero’s weekly hike – Mapping if LocalMonero’s closure can stop its rally

- Demand for XMR has spiked over the last few days
- This happened despite the proposed plan to shut down LocalMonero
Monero’s native coin XMR appears poised to extend its seven-day rally, despite the negative sentiments around the closure of LocalMonero, a peer-to-peer (P2P) trading platform for the privacy coin.
On 7 May, LocalMonero announced that it has disabled all new sign-ups and advertisement postings for XMR on its platform. It added that on 14 May, it would disable new XMR trades, and by 7 November, its website would be taken down.
XMR looks the other way
At press time, the popular privacy coin was valued at $132.52, rallying by 8% in the last 7 days, according to CoinMarketCap. This, despite the fact that the broader market has remained largely circumspect over the past.
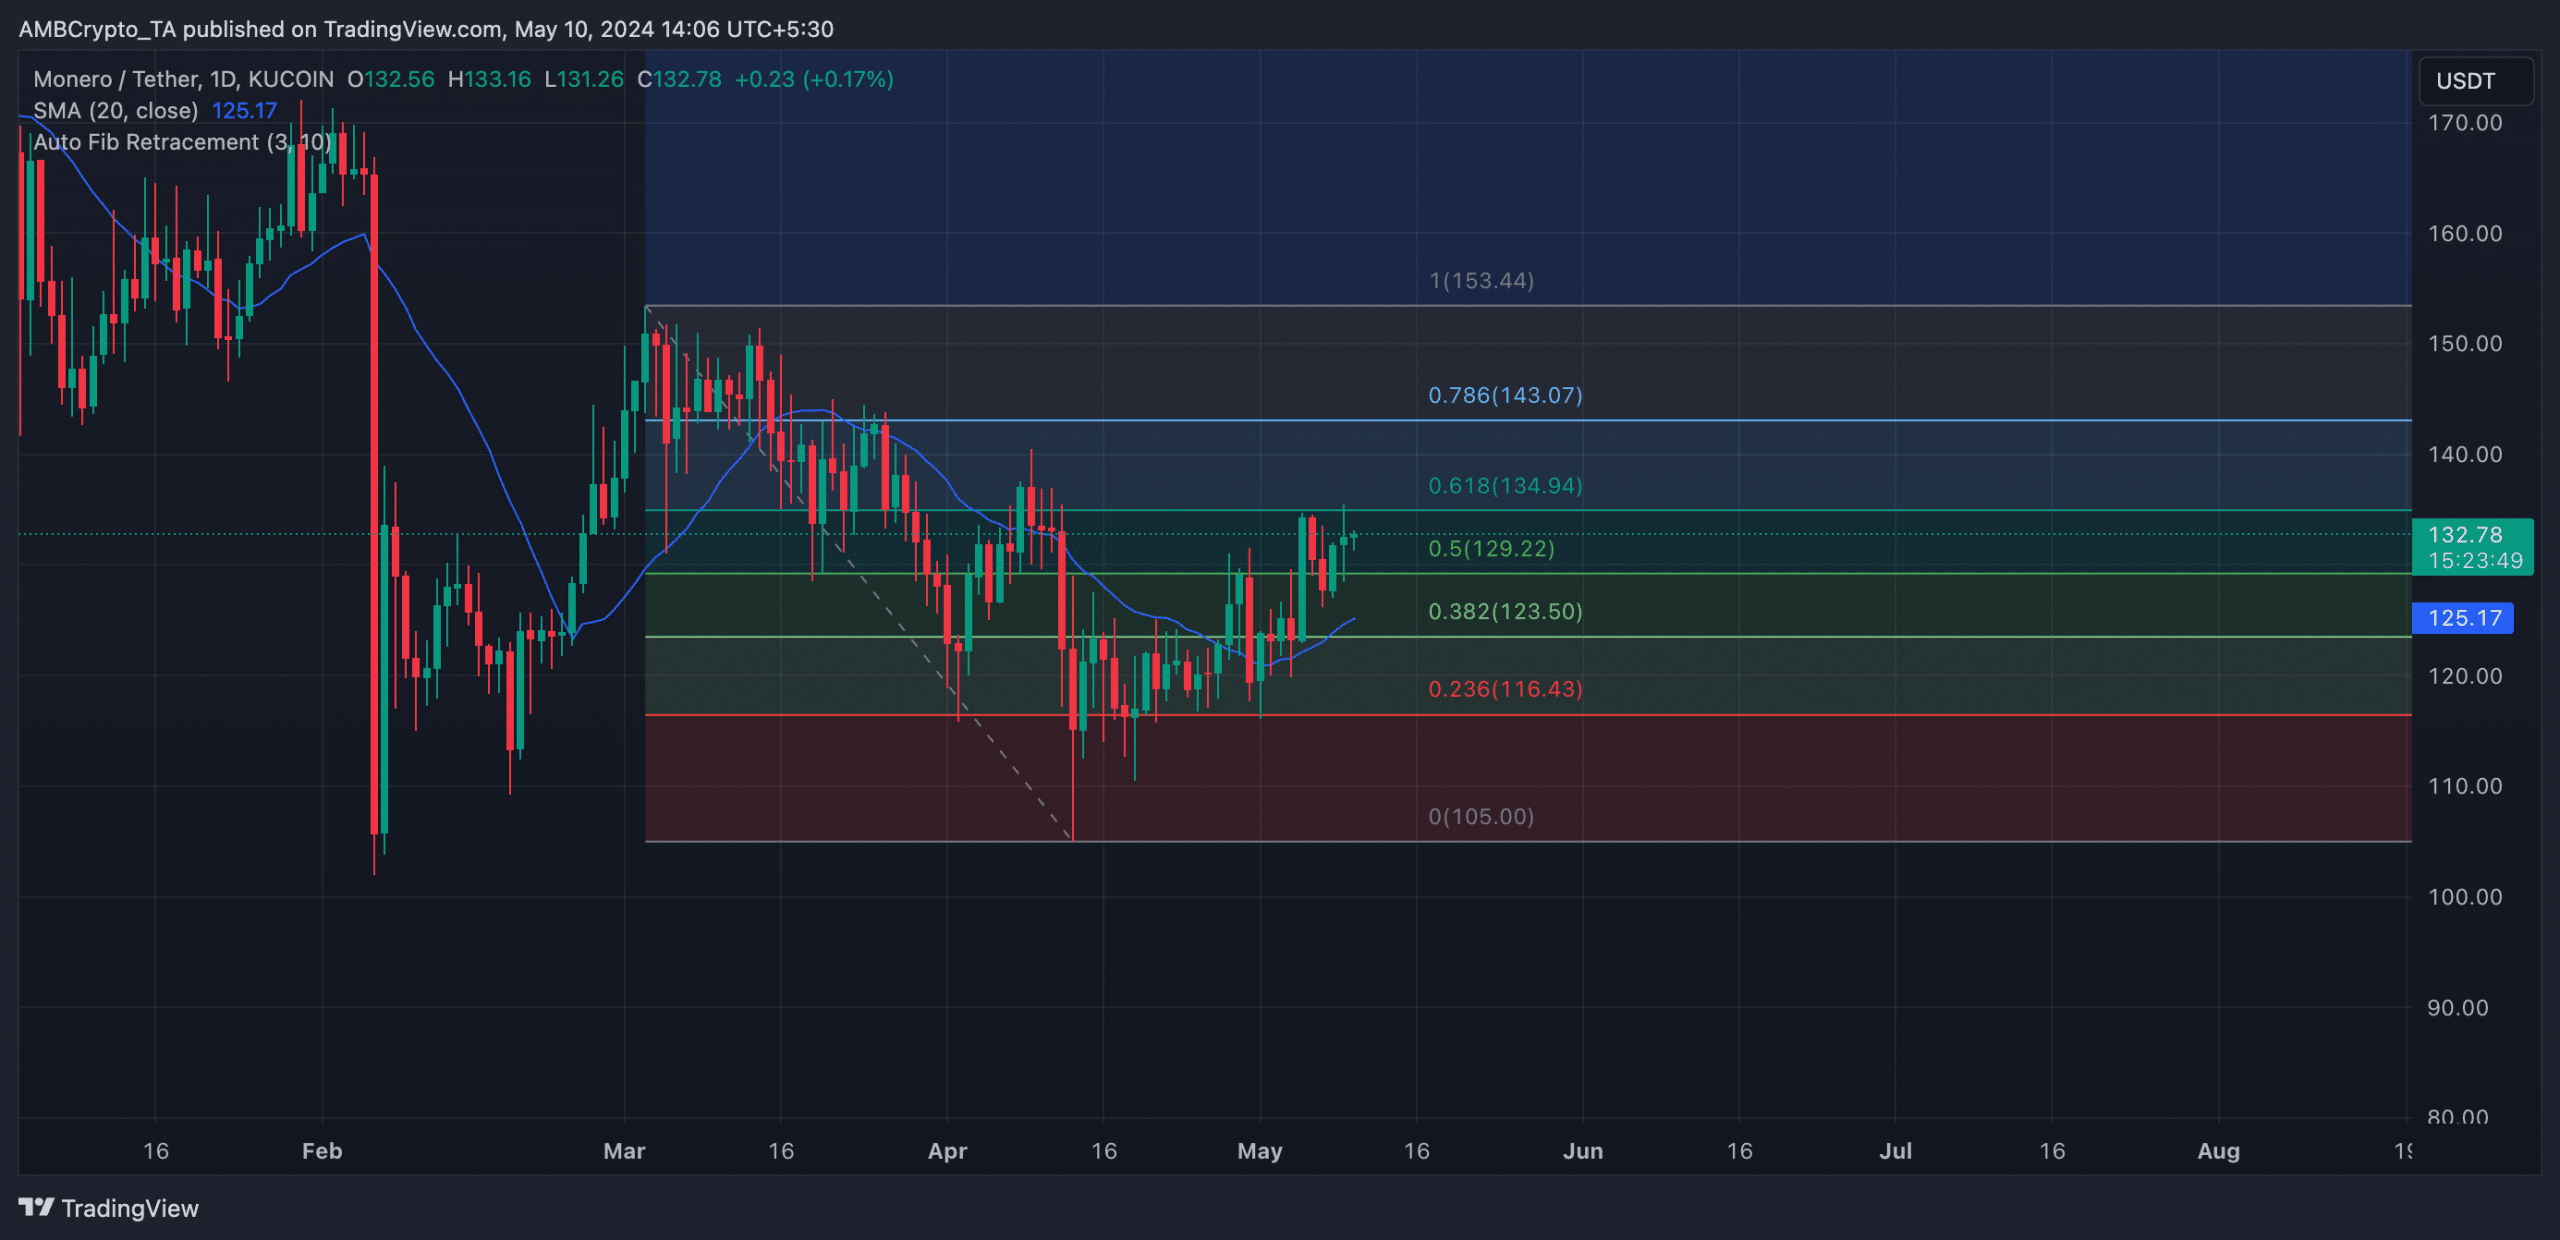
An assessment of its price performance on the daily chart confirmed the possibility of an extended rally in the short term. For instance, at press time, the altcoin’s price lay above its 20-day small moving average (SMA). An asset’s 20-day SMA is a short-term moving average that reflects its average closing price over the past 20 days.
When it is positioned below an asset’s price, it suggests that the short-term trend for the asset is upward. This is often viewed as a sign that buyers are in control of the market and that a sustained rally is possible.
An asset’s 20-day SMA is a short-term moving average that reacts quickly to price changes. It reflects the average closing price of an asset over the past 20 days.
Read Monero’s [XMR] Price Prediction 2024-25
Furthermore, XMR’s rising momentum indicators signalled high buying momentum across the market. At press time, the coin’s Relative Strength Index (RSI) was 57.13, while its Money Flow Index (MFI) was 71.69.
At these values, these indicators suggested that market participants favoured XMR accumulation over its distribution.
Confirming an inflow of liquidity into the XMR market, its Chaikin Money Flow (CMF) had a reading of 0.14, at the time of writing. This indicator measures the flow of money into and out of an asset, with a positive CMF viewed as a sign of positive market strength.
Regarding XMR’s next price point, readings from its Fibonacci retracement revealed that if it successfully breaches the $134-price level, it would aim to exchange hands at $143 on the charts.
However, if this is invalidated and the bears exert pressure on the market, the altcoin’s price may fall below $125.


![Kusama [KSM] explodes 119% in one day - How DOT helped](https://ambcrypto.com/wp-content/uploads/2024/11/Michael-KSM-400x240.webp)


