Bitcoin’s affair with Coinbase – Over $1 billion in BTC moved and more…

- There have been seven batches of outflows of over 15,000 BTC from Coinbase since February
- BTC also recorded its highest netflows since December 2023
A recent analysis has identified a consistent pattern of Bitcoin outflows from a specific exchange. These outflows have been observed over several months. This pattern contributed to Bitcoin noting record netflows, with the same coinciding with the king coin climbing to $66,000 on the price charts.
Bitcoin ‘sexchange outflow pattern
Recent data from CryptoQuant revealed significant outflows of 16,021 Bitcoin from Coinbase on 15 May. While such an outflow might not immediately raise concerns, further analysis uncovered a pattern that has been consistent since February. Over this period, seven outflows have exceeded 15,000 BTC, establishing a noticeable pattern on the exchange.
The latest outflow episode was valued at over $1 billion, considering BTC’s press time price above $66,000 on 16 May. And, the same transpired in the middle of a notable hike in overall volumes.
Bitcoin sees record netflows
An analysis of Bitcoin’s outflow chart from CryptoQuant revealed a significant surge in outflows on 15 May, marking its highest level in weeks. The outflow volume was over 55,217 BTC, equivalent to over $3.6 billion. This outflow level had not been observed since 28 March, coinciding with a period when Bitcoin’s price reached around $70,000.
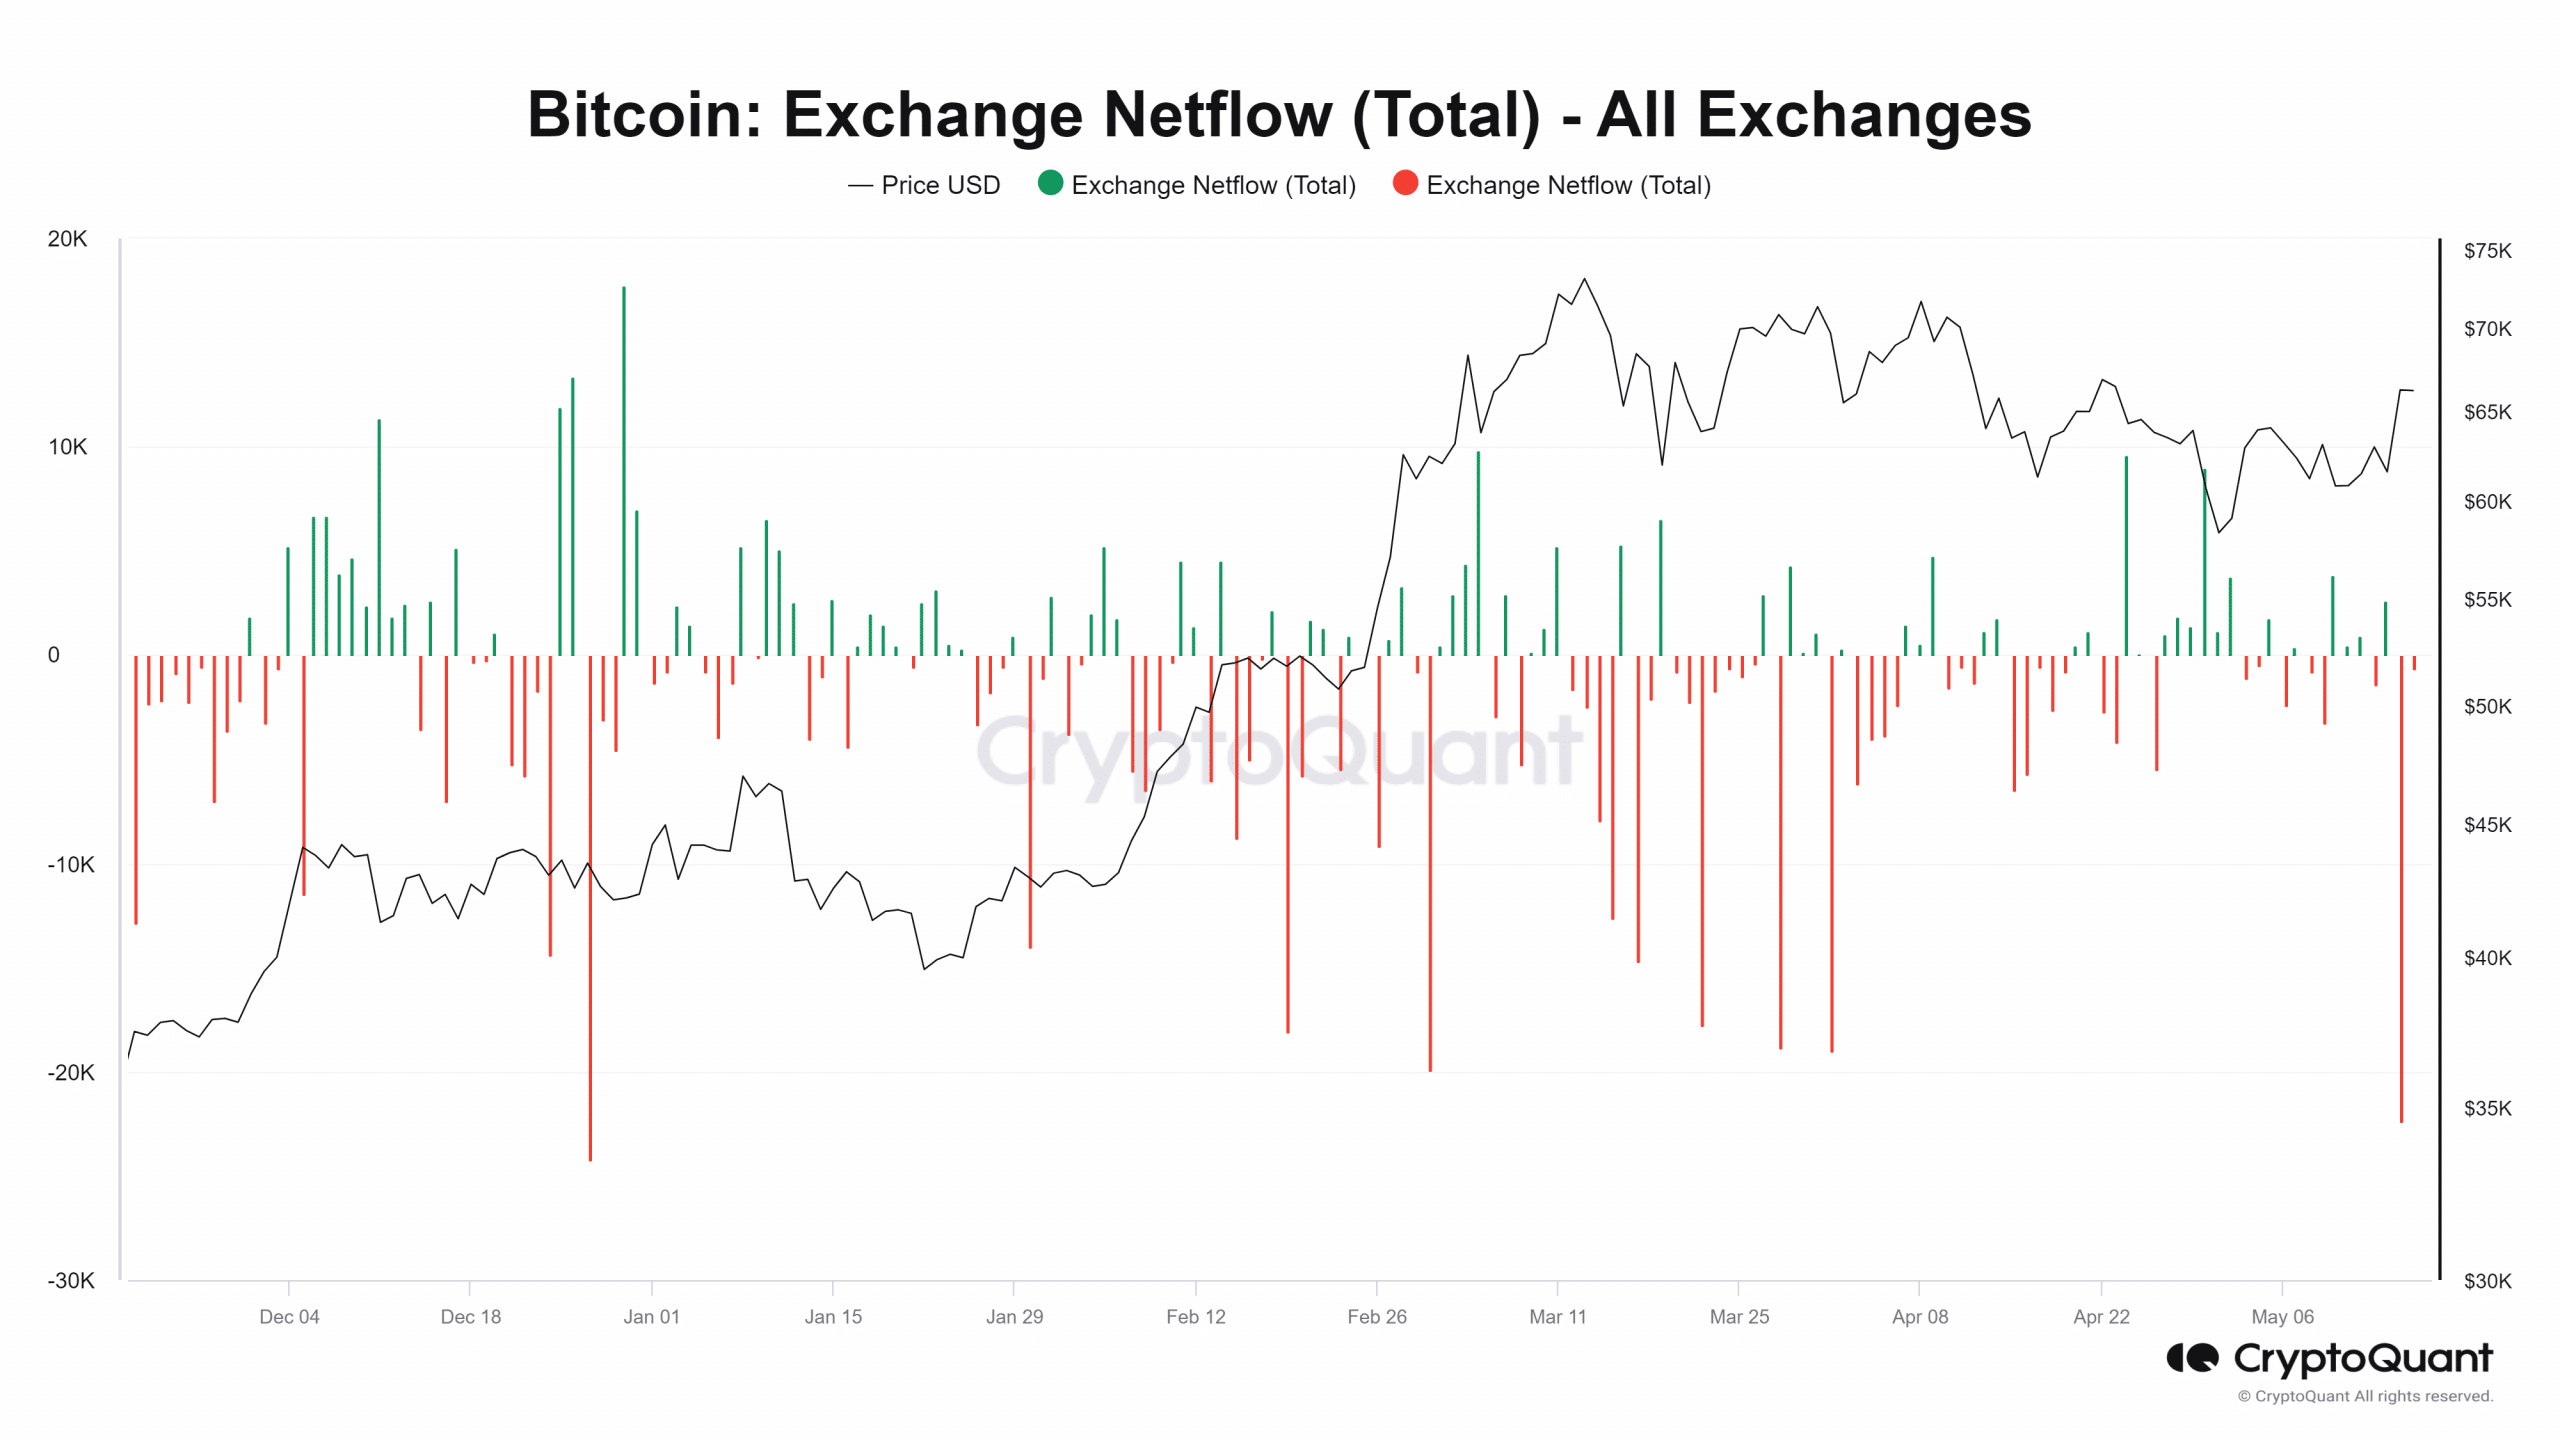
Furthermore, BTC registered its highest netflow in months on 15 May, as indicated by the exchange netflow chart. The netflow recorded a volume of over -23,359 BTC, indicating that substantial outflows exceeded inflows across all exchanges.
This negative netflow level was yet to be seen since December 2023. At press time, outflows continued to dominate exchange flows, suggesting the ongoing movement of BTC away from exchanges.
BTC re-enters the $66,000 price range
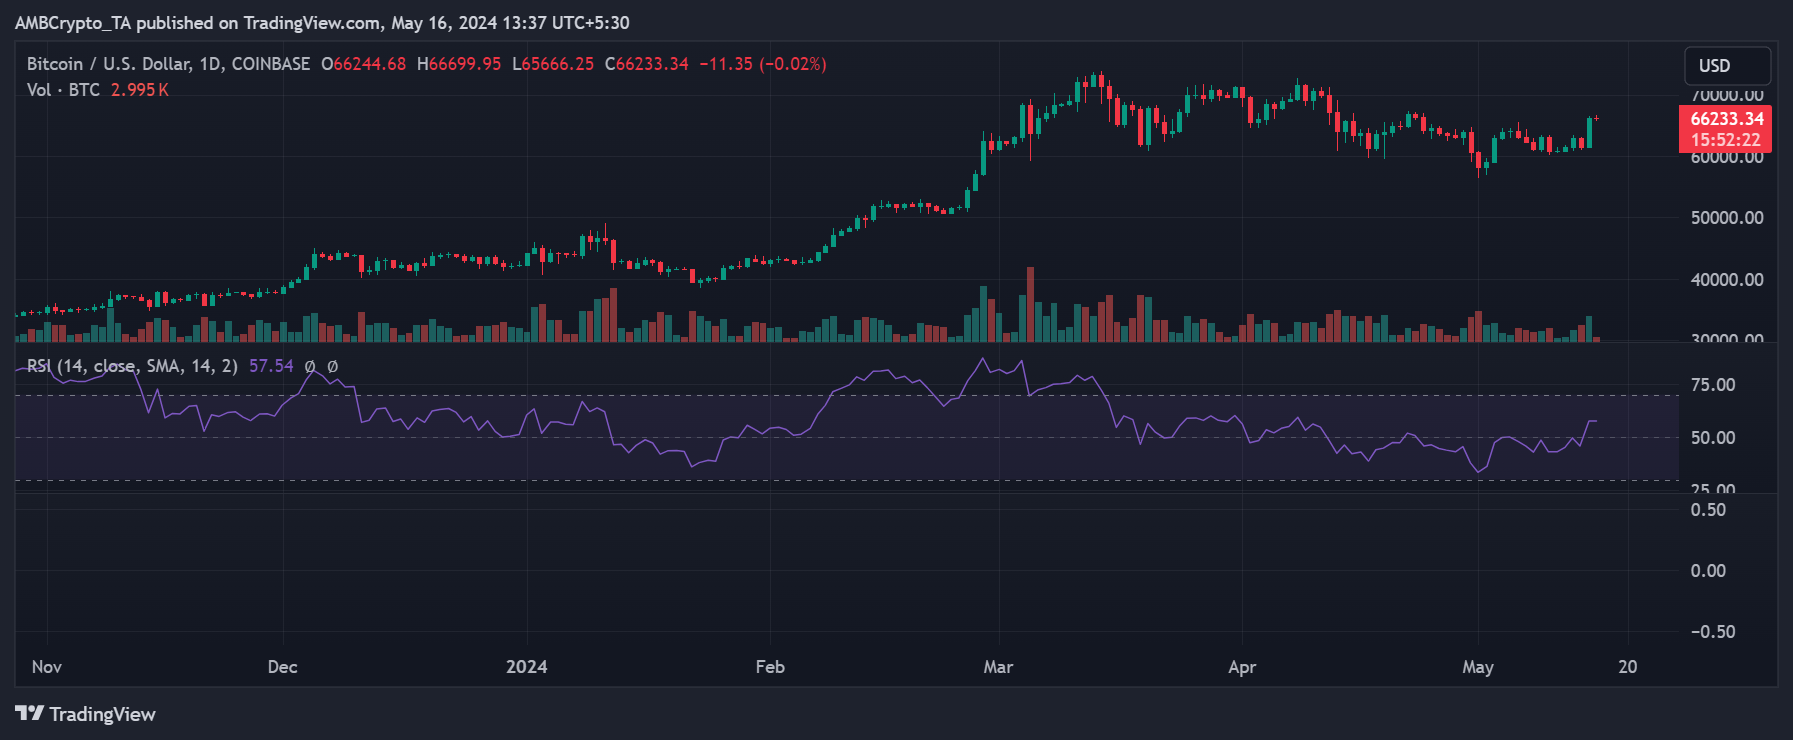
Bitcoin’s price surged by 7.65% on 15 May, propelling it to $66,244, at press time. This marked a return to the price range unseen since its decline below this level around 12 April.
– Read Bitcoin (BTC) Price Prediction 2024-25
Additionally, this recent price movement has pushed Bitcoin’s Relative Strength Index (RSI) above the neutral zone.
In fact, an analysis of the RSI indicated that it was trending above 50 after several weeks below this threshold. This shift in the RSI can be interpreted to be a positive sign for Bitcoin’s bulls.


