Bitcoin repeats THIS historical pattern: Is a bull rally coming?
The stablecoin supply ratio oscillator currently shows bullishness, which could help BTC rise.
- Bitcoin saw a sharp rally in early May.
- The drop below the SSR oscillator bands was seen then- but will we see an extended rally hereon?
Bitcoin [BTC] was trading at $67k at press time and threatened to break out past the range that it consolidated within over the past month.
Fears around sell-offs around the halving period were losing strength.
Bitcoin ETFs also saw inflows over the past week, indicating a tangible increase in demand. The push to the range highs relieved the selling pressure of recent weeks, but can the bulls manage a breakout?
Gauging the ammo reserves of the bulls
A crypto analyst highlighted in a post on X (formerly Twitter) that the stablecoin supply ratio (SSR) oscillator showed bullishness.
The technical indicator assesses stablecoin market sentiment relative to Bitcoin over time.
It is calculated by taking the current SSR and its difference with the 200-period simple moving average. This value is divided by its standard deviation over the same period to arrive at a set of Bollinger Bands (BB).
The current stablecoin supply is plotted over these bands to give traders insights into what the market sentiment is like.
When the SSR falls below the lower Bollinger Band, it indicates low stablecoin dominance and potential bullish sentiment.
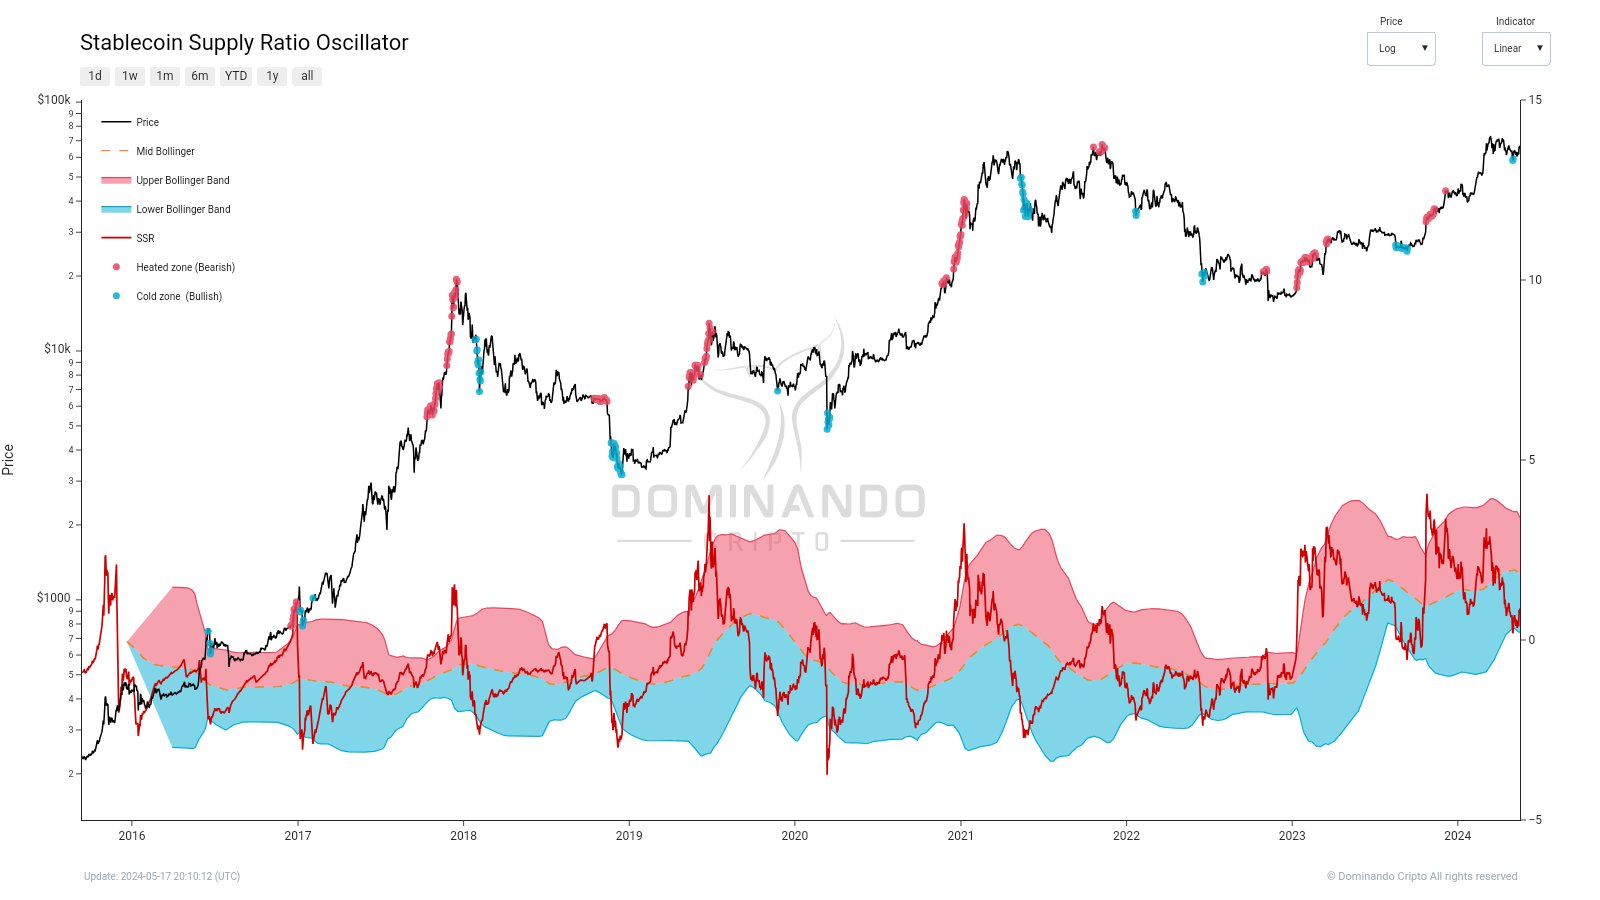
The chart above highlights how the market tends to pull back when the oscillator is overheated. Conversely, when the lower bands are breached, it generally provides a good long-term buying opportunity.
Like any other technical indicator, the SSR oscillator was not infallible, and each signal was not a guarantee of a price move in the expected direction.
We are still within a “buy” signal
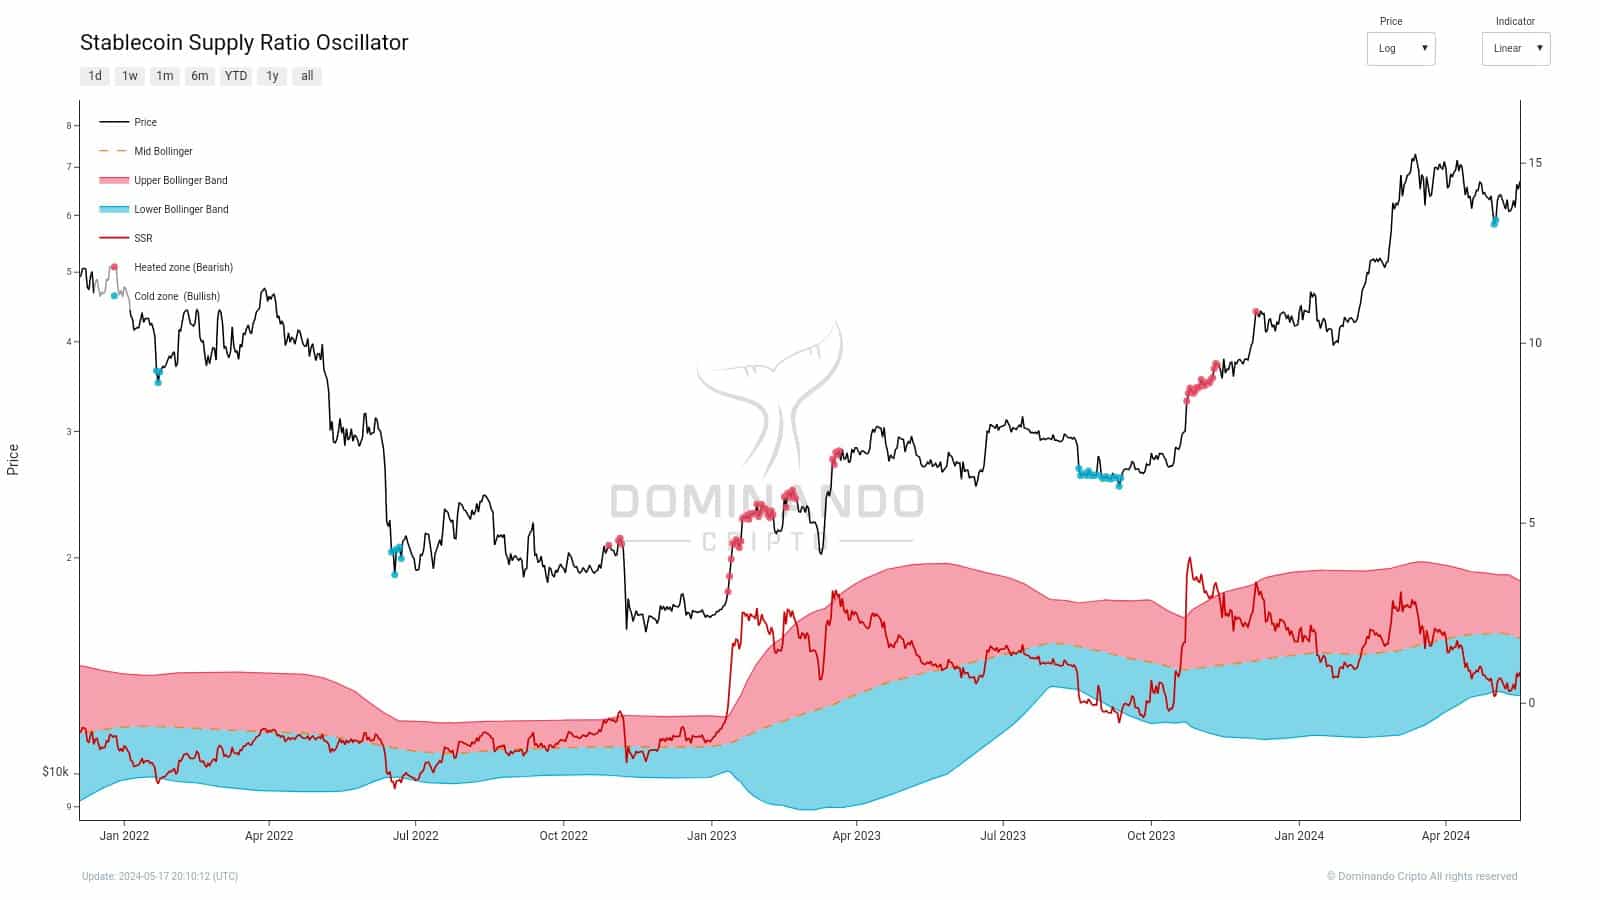
The stablecoin supply ratio was below the 200-period SMA but above the lower BB. It fell below this band in early May, when Bitcoin prices reached $56k. However, the price immediately rebounded higher.
The oscillator was still in the lower BB and suggested that further gains were likely. The SSR also saw a downtrend over the past month.
Is your portfolio green? Check out the BTC Profit Calculator
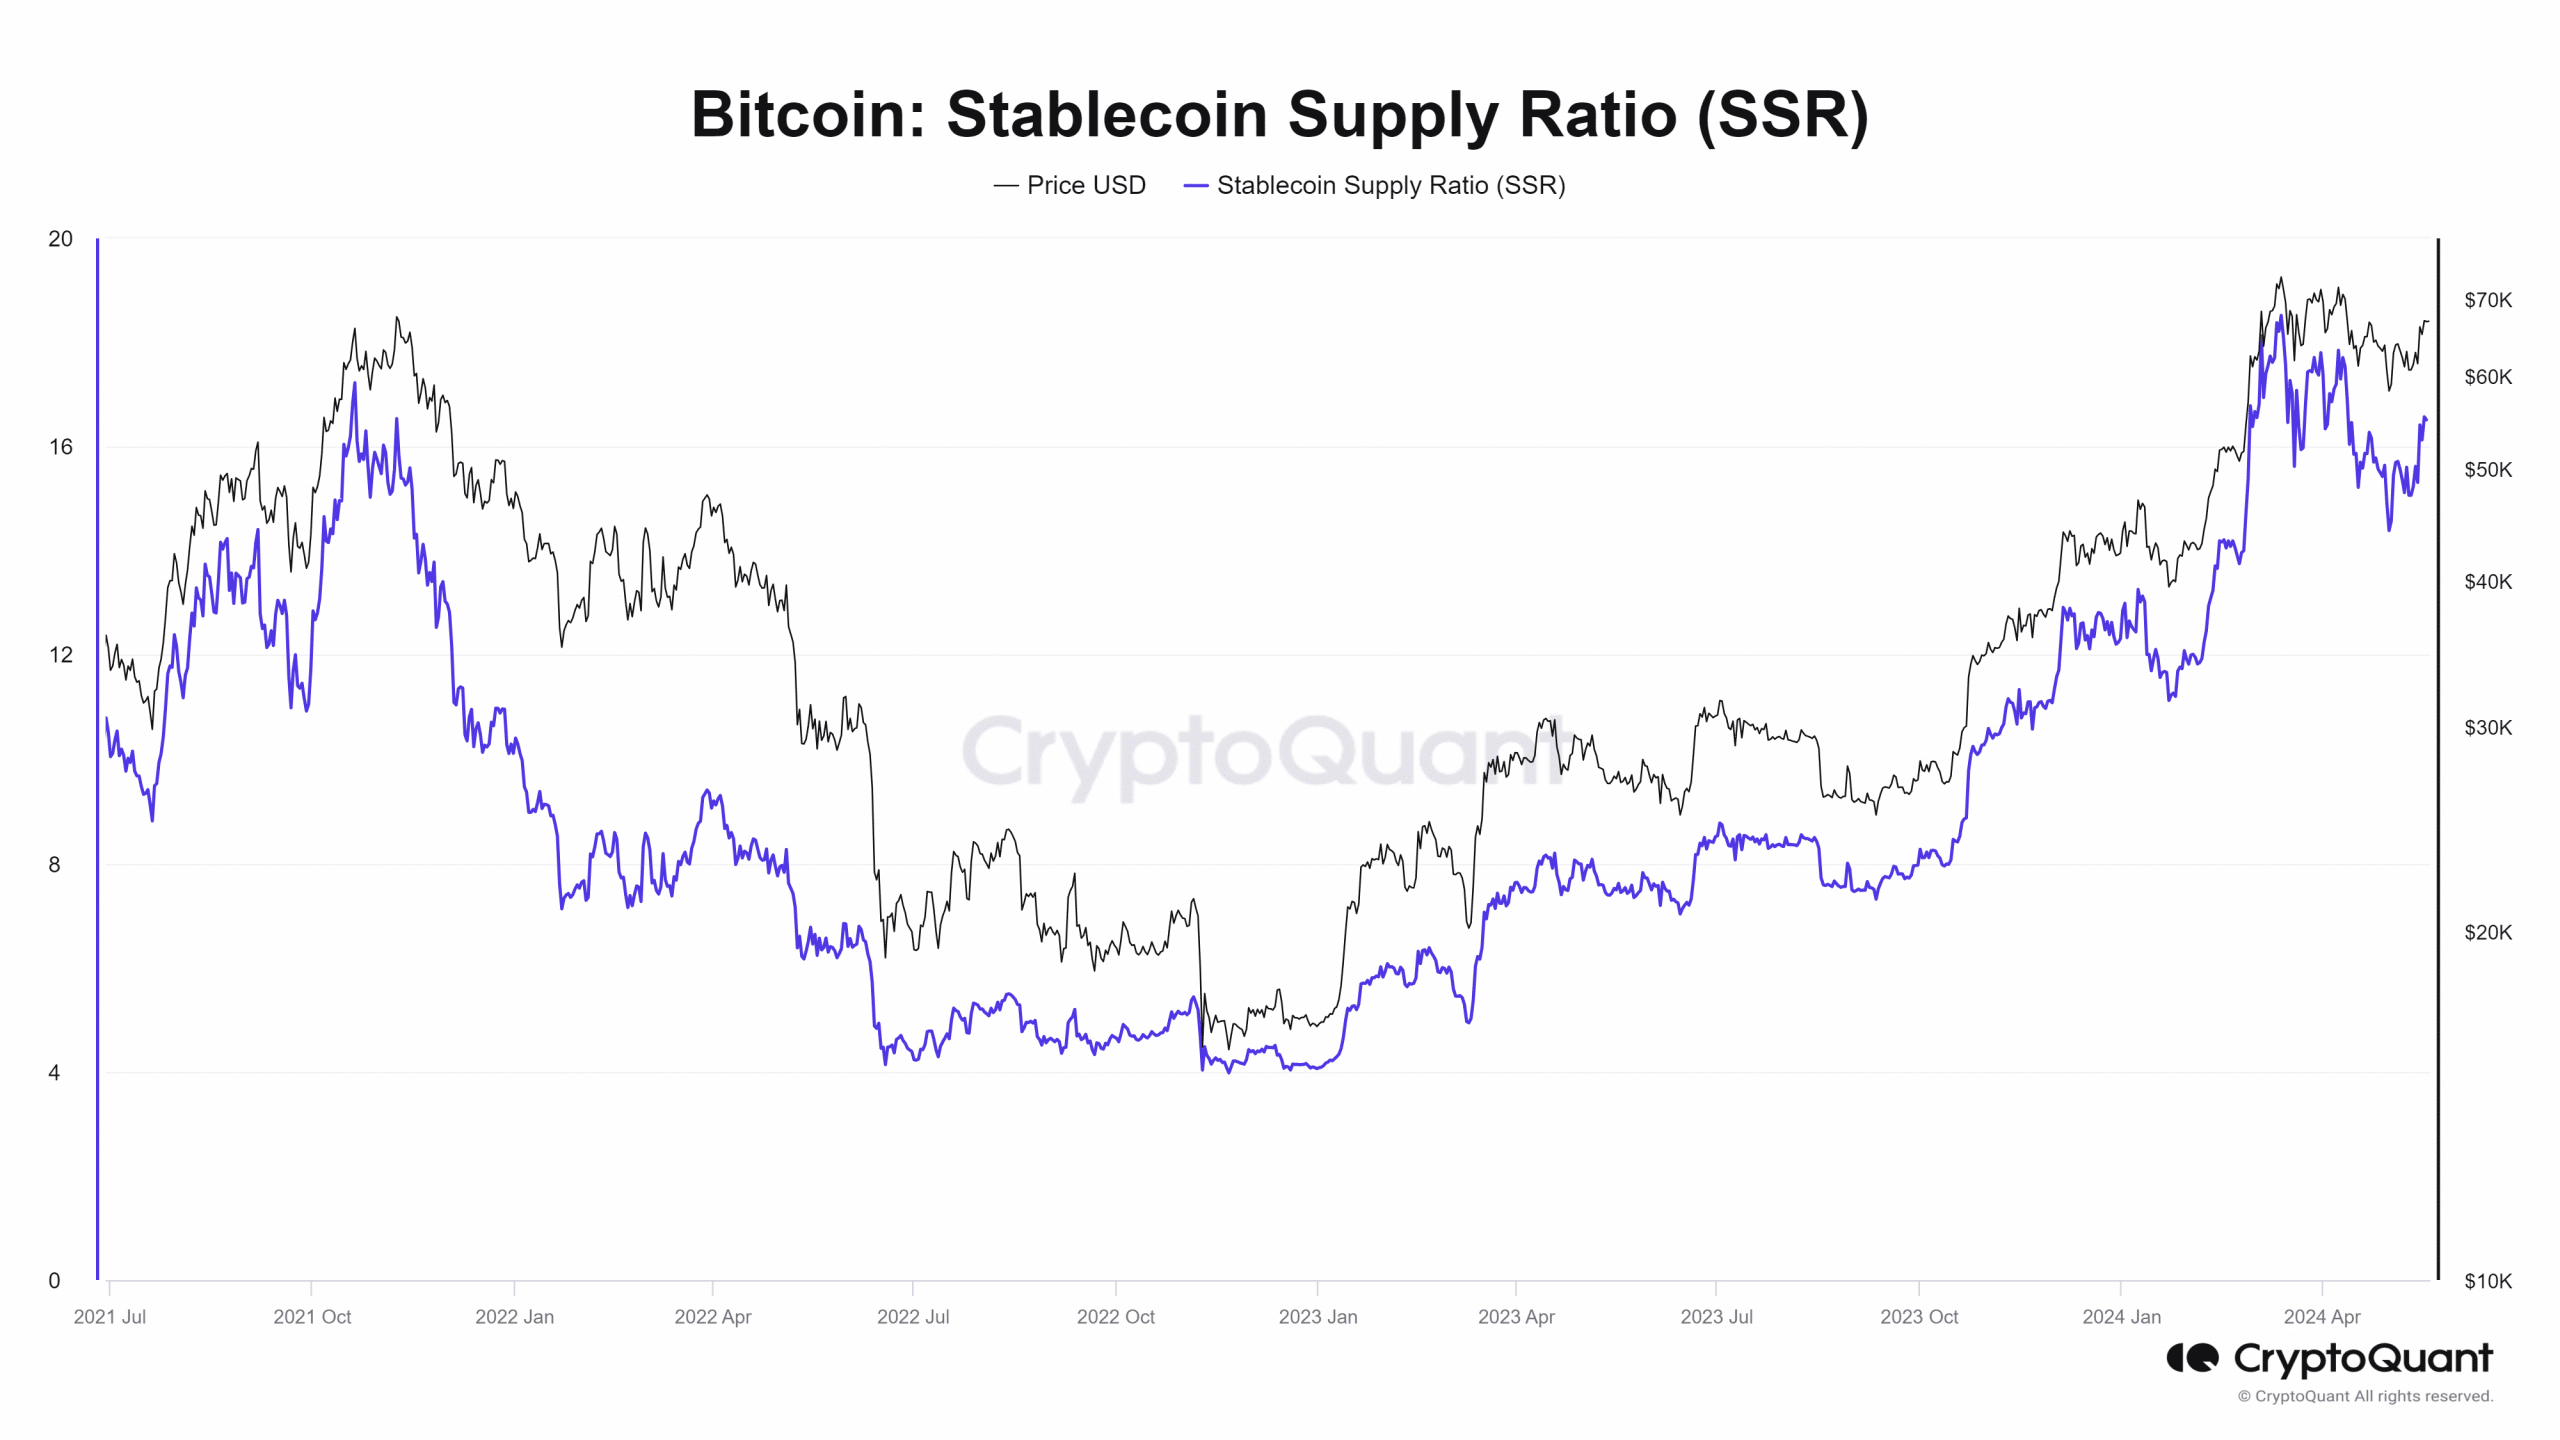
The metric has been aggressively trending higher since October 2023. Periods of stasis or pullback such as early January and mid-May were present.
A month after the January pullback, Bitcoin prices rocketed higher to breach the $46k resistance with ease. Perhaps in the next 2–4 weeks, we might see a Bitcoin rally push well beyond the $73k resistance.