Assessing whether Solana can reach $200 before May ends
Solana's highly volatile market could steer bullish pressure to the resistance zone or a retest to the demand zone.
- SOL recorded a 165% surge from late January to late March.
- Solana has been consolidating inside a bullish pennant since early March 2024.
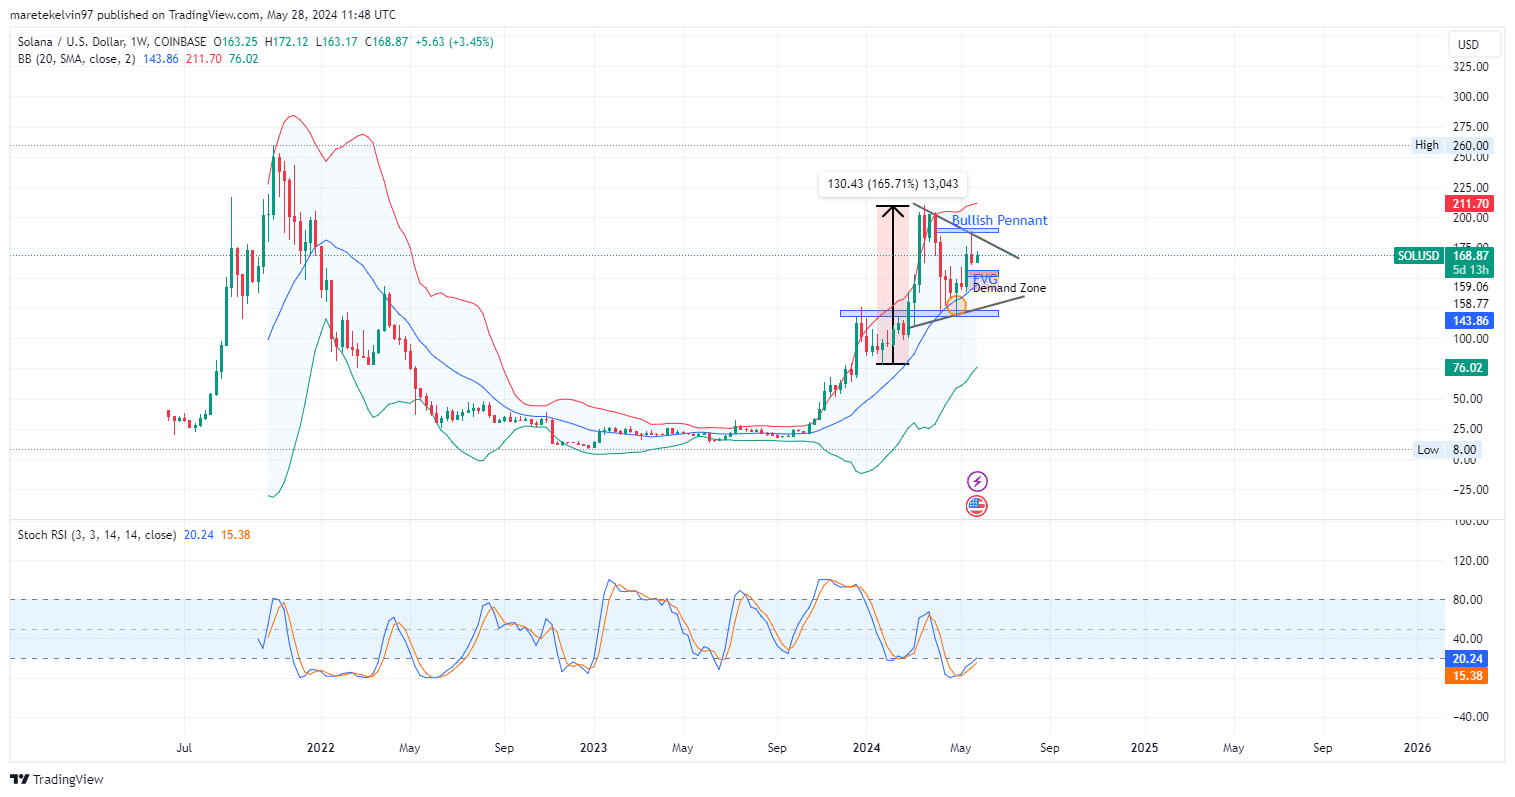
Solana [SOL] had experienced a surge of 165% as from late January to late March before consolidating in a bullish pennant.
At press time, the price of Solana was at around $167.30. SOL was still consolidating in the bullish pennant before the likely continuation surge.
The fair value gap at around $153 zone and a demand zone just below the fair value gap at around $145 are acting price magnets for a possible correction before retracing to the Pennant resistance level.
If the price manages to drop beyond the demand zone, a further drop to the pennant support level is possible.
However, if the price retraces at the demand zone after filling the fair value gap, and build enough bullish momentum to breakout of the pennant resistance zone, a surge to $200 target is likely.

As of this writing, according to data from CoinMarketCap, SOL was trading at $167.83, a 1.34% gain in the last 24 hours and a 7.93% drop in the last 7 days.
Solana’s market cap was $75.5 billion, with a 24-hour trading volume of $2.99 billion, a 21.8% increase.
What does Solana’s future look like?
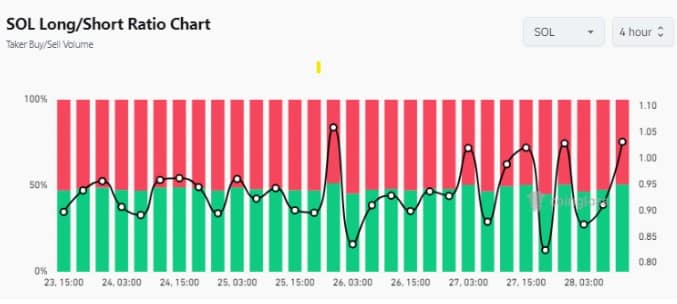
AMBCrypto’s look at Coinglass data on Solana Long/Short Ratio Chart, showed that long — short ratio has been high in the last several days, indicating bullish momentum was building.
This is because a high long short ratio indicates bullish momentum and that traders have an appetite to buy and hold.
Additionally, the Bollinger bands in the daily chart were widened, showing a high volatile market that could steer the bullish pressure to the resistance zone or a retest to the demand zone.
The stochastic RSI (20.24) showed an oversold reading, suggesting a positive retracement to a bull run.
AMBCrypto’s look at the social volume chart from Santiment showed a positive correlation between Solana’s price and social volume. Increased social media activity drives public interest, leading to price surges.