Polygon: Waiting for MATIC’s bullish break out? Key insights here
A cluster of long liquidation levels is at $0.8, and another cluster at $0.762, meaning that bulls must be wary.
- MATIC lacked a trend on the higher timeframes.
- A revisit to the mid-range level could serve as a buying opportunity.
Polygon [MATIC] was unable to shake off the bearish oppression. The price continued to trade within the two-month range despite the positive sentiment across the market.
This sentiment shift came after Bitcoin [BTC] climbed above $70k after defending the $67k level as support. An immediate breakout was not guaranteed for either Polygon or Bitcoin. Here’s what MATIC traders can expect in June.
More boring price action to follow?
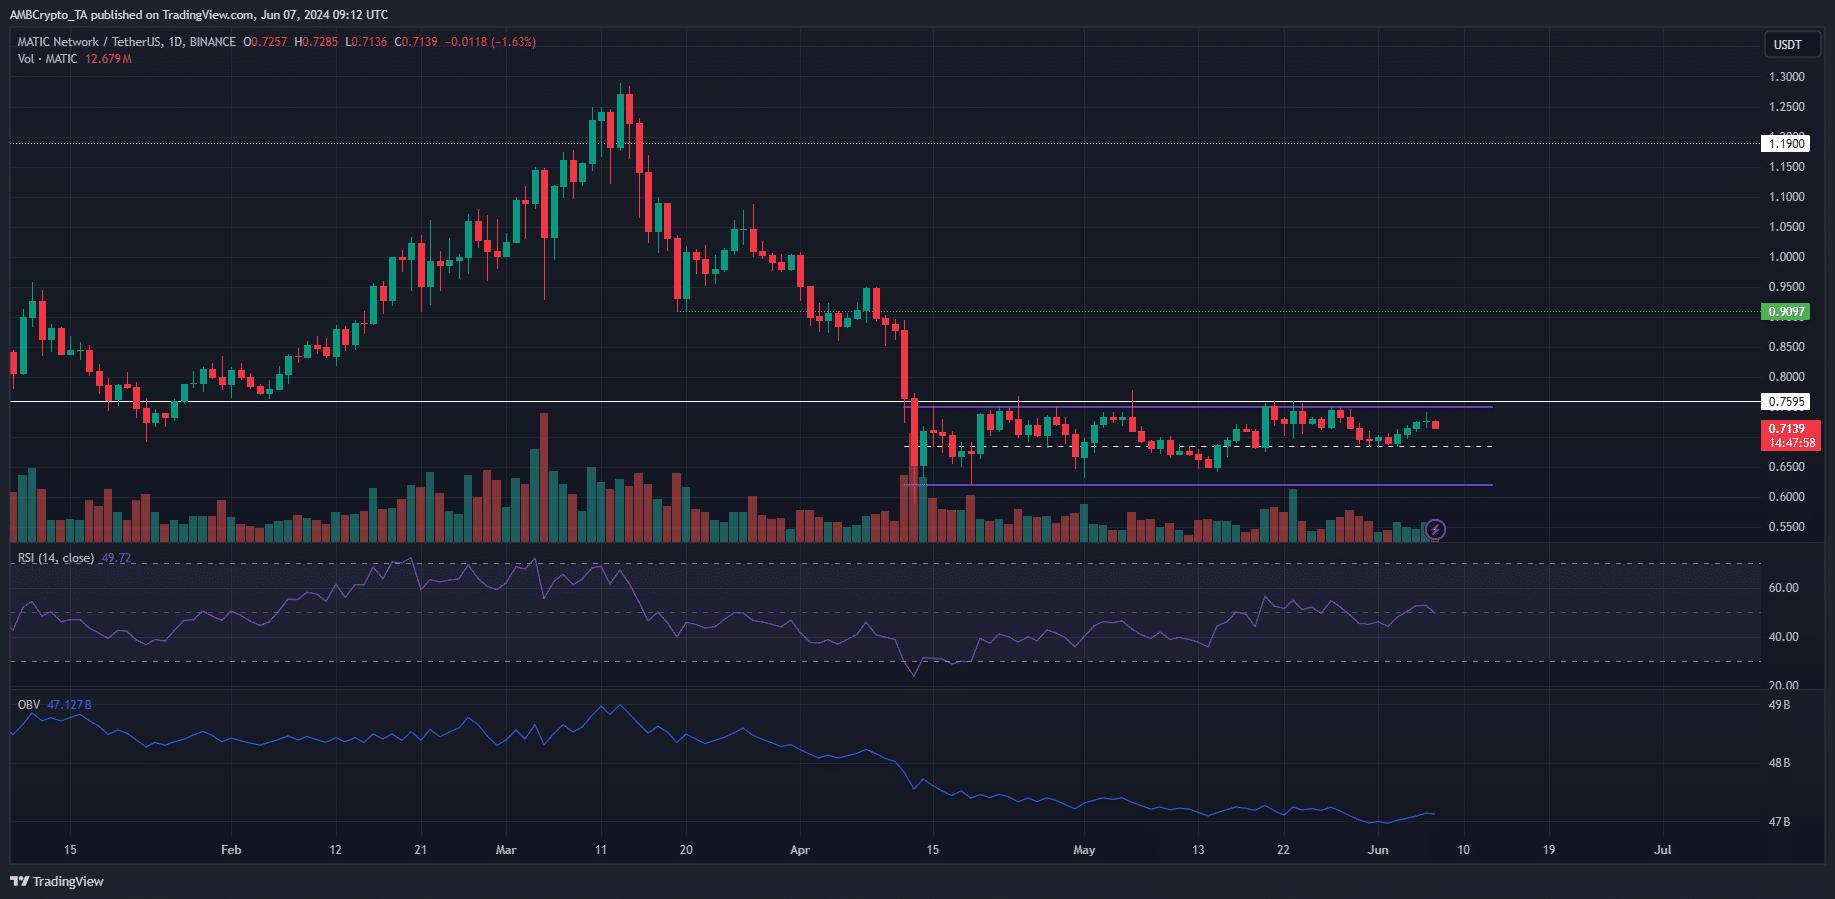
After the strong gains made in February, the $1 level was flipped to support in the first half of March. However, the bulls were unable to keep hold of it.
Moreover, they could do little to halt MATIC’s slump to the $0.6 level, below even the January low of $0.69.
The range formation (purple) extended from $0.75 to $0.62, with the mid-range level at $0.685. This support has been defended over the past month and is likely to see prices bounce in the event of another retest.
The 1-day RSI was hovering around 50 to signal a lack of momentum. If the OBV can climb above the recent lower highs, it would be an early sign that MATIC is preparing for a breakout.
The liquidity pockets show a bullish breakout might be perilous
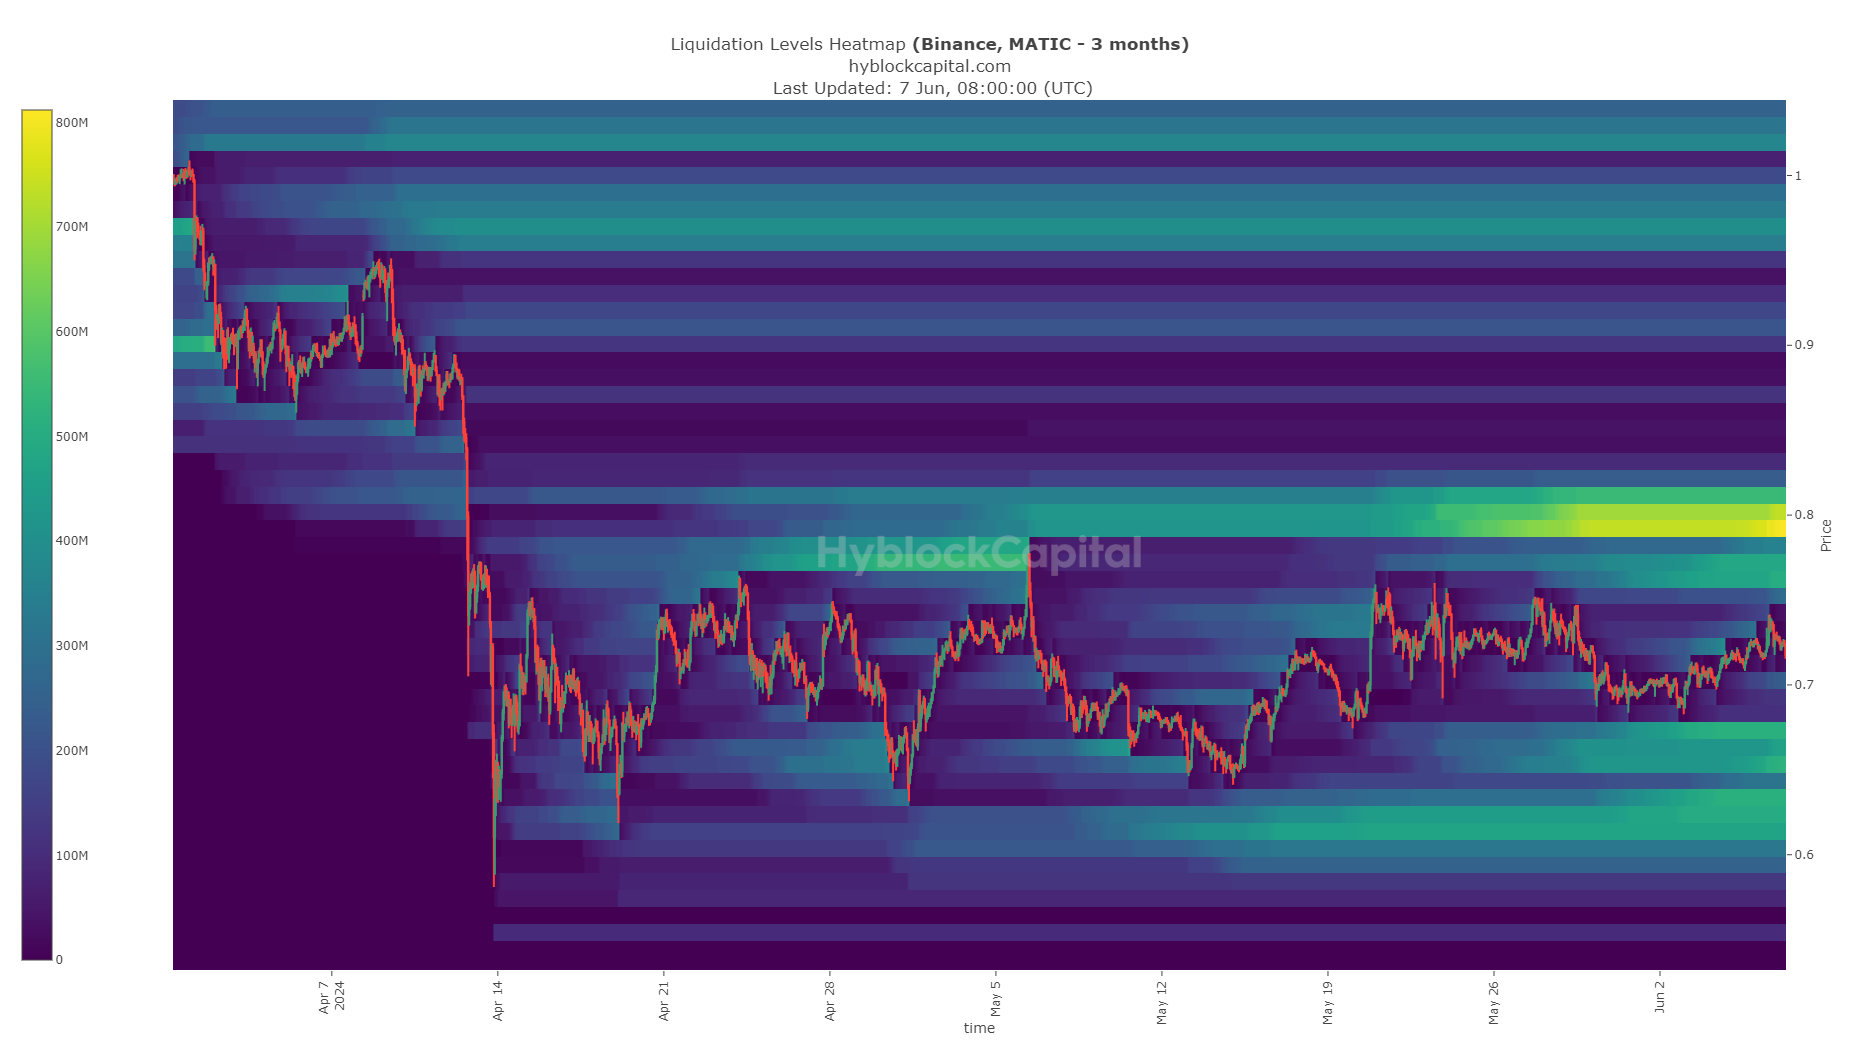
The range high is at $0.75. A cluster of long liquidation levels is at $0.8, and another cluster at $0.762.
Is your portfolio green? Check the Polygon Profit Calculator
This meant that even if prices break out beyond the two-month range, they could meet a reversal at the $0.8 area.
Therefore, investor caution is warranted. Traders could look to treat the $0.75-$0.8 as a resistance zone and position themselves accordingly.
Disclaimer: The information presented does not constitute financial, investment, trading, or other types of advice and is solely the writer’s opinion.