Bitcoin faces downward pressure as Mt. Gox prepares for repayments
A sudden, sharp drop in Bitcoin prices is possible given the daily RSI's dive into the oversold territory.

- News of repayments in Bitcoin and Bitcoin Cash is likely to put additional downward pressure on the two assets.
- The metrics and futures data showed that the next week is likely to see more losses.
Bitcoin [BTC] was in a tough spot after persistent selling pressure forced prices down from $71.9k on the 6th of June to $61.4k at press time. The $60.5k level was visited just a few hours earlier and came on the back of news from the Bitcoin exchange Mt. Gox.
The now-defunct exchange saw a massive hack in 2014 that resulted in a loss of approximately 740,000 BTC, worth $15 billion at current market prices.
It was once the world’s top exchange, but a lot has changed since then. The repayments of the assets stolen from clients faced years of delayed deadlines, but finally, an announcement came on the 24th of June, Monday, that repayments would commence in July 2024.
Rehabilitation Trustee Nobuaki Kobayashi stated that the Rehabilitation Plan will see repayments made in Bitcoin and Bitcoin Cash [BCH], which could add to the selling pressure in the market on these assets.
Exploring the impact of this news
In late May, an AMBCrypto report highlighted that the exchange moved 140,000 BTC, worth $9.4 billion back then. The movement did not immediately impact prices, but a week later, BTC formed a local top just below the $72k mark.
It is possible that the wave of selling pressure in the weeks since then anticipated developments of this sort. If a sizeable portion of that amount enters the markets, it could add to Bitcoin’s woes and heighten the selling pressure.
From the 8th to the 14th of May 2024, BTC bulls fought valiantly to defend the $60k support zone and succeeded in driving prices higher to $71.9k on the 21st of May.
Therefore, another retest of the $60.2k-$61.5k region is likely to see a positive reaction.
Metrics indicate that the correction could be coming to an end
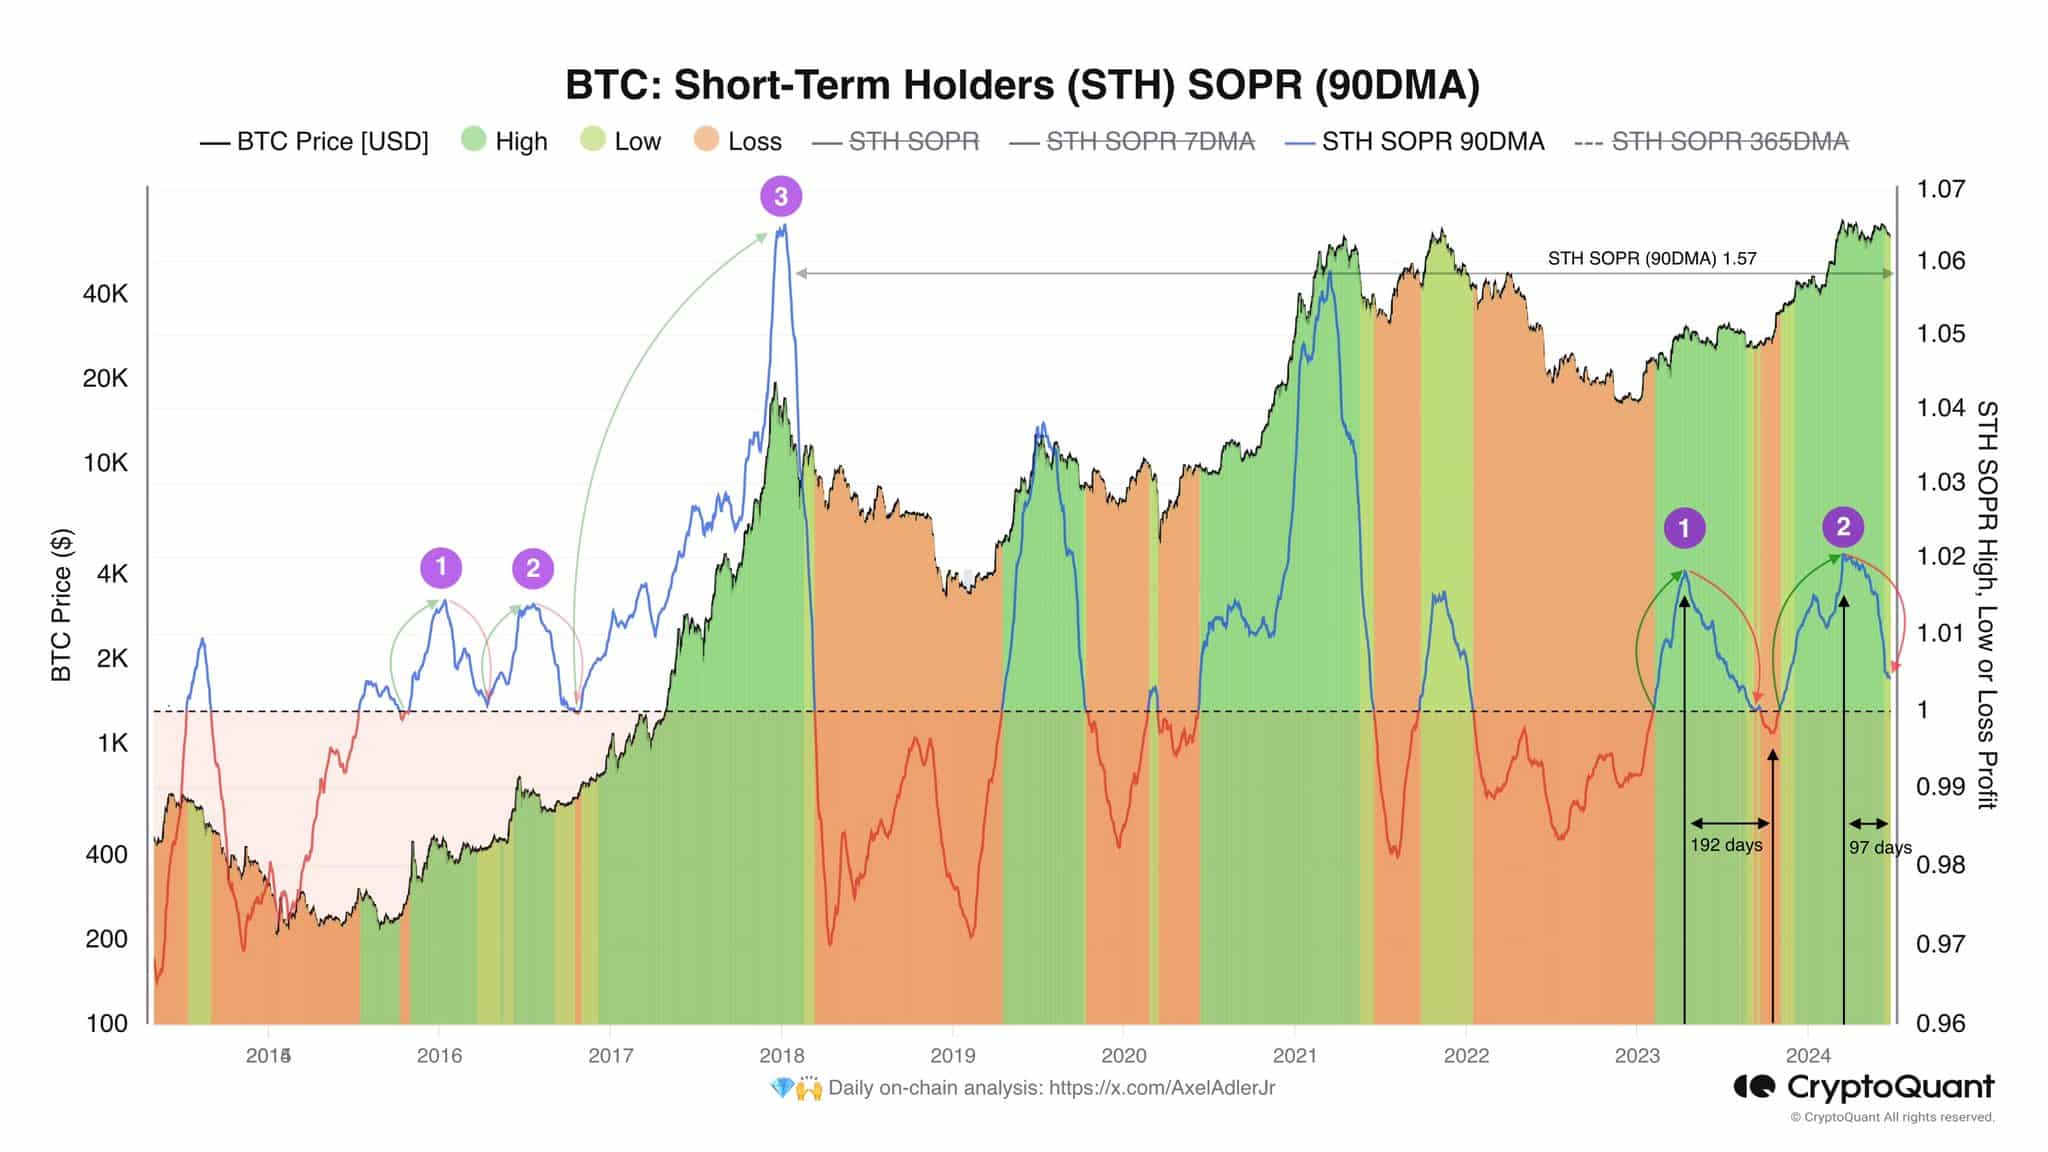
Crypto analyst Axel Adler posted on X (formerly Twitter) and drew attention to the short-term holders’ (STH) spent output profit ratio (SOPR) metric.
The 90-day moving average (90DMA) was just above 1 at press time. Compared to the 2016 cycle, it is possible that Bitcoin could continue its correction until this metric falls below 1.
Thereafter, the possibility of a trend reversal in favor of the bulls would become more likely, he observed. This process could take time, and traders and investors might see more losses or consolidation for BTC in the coming weeks.
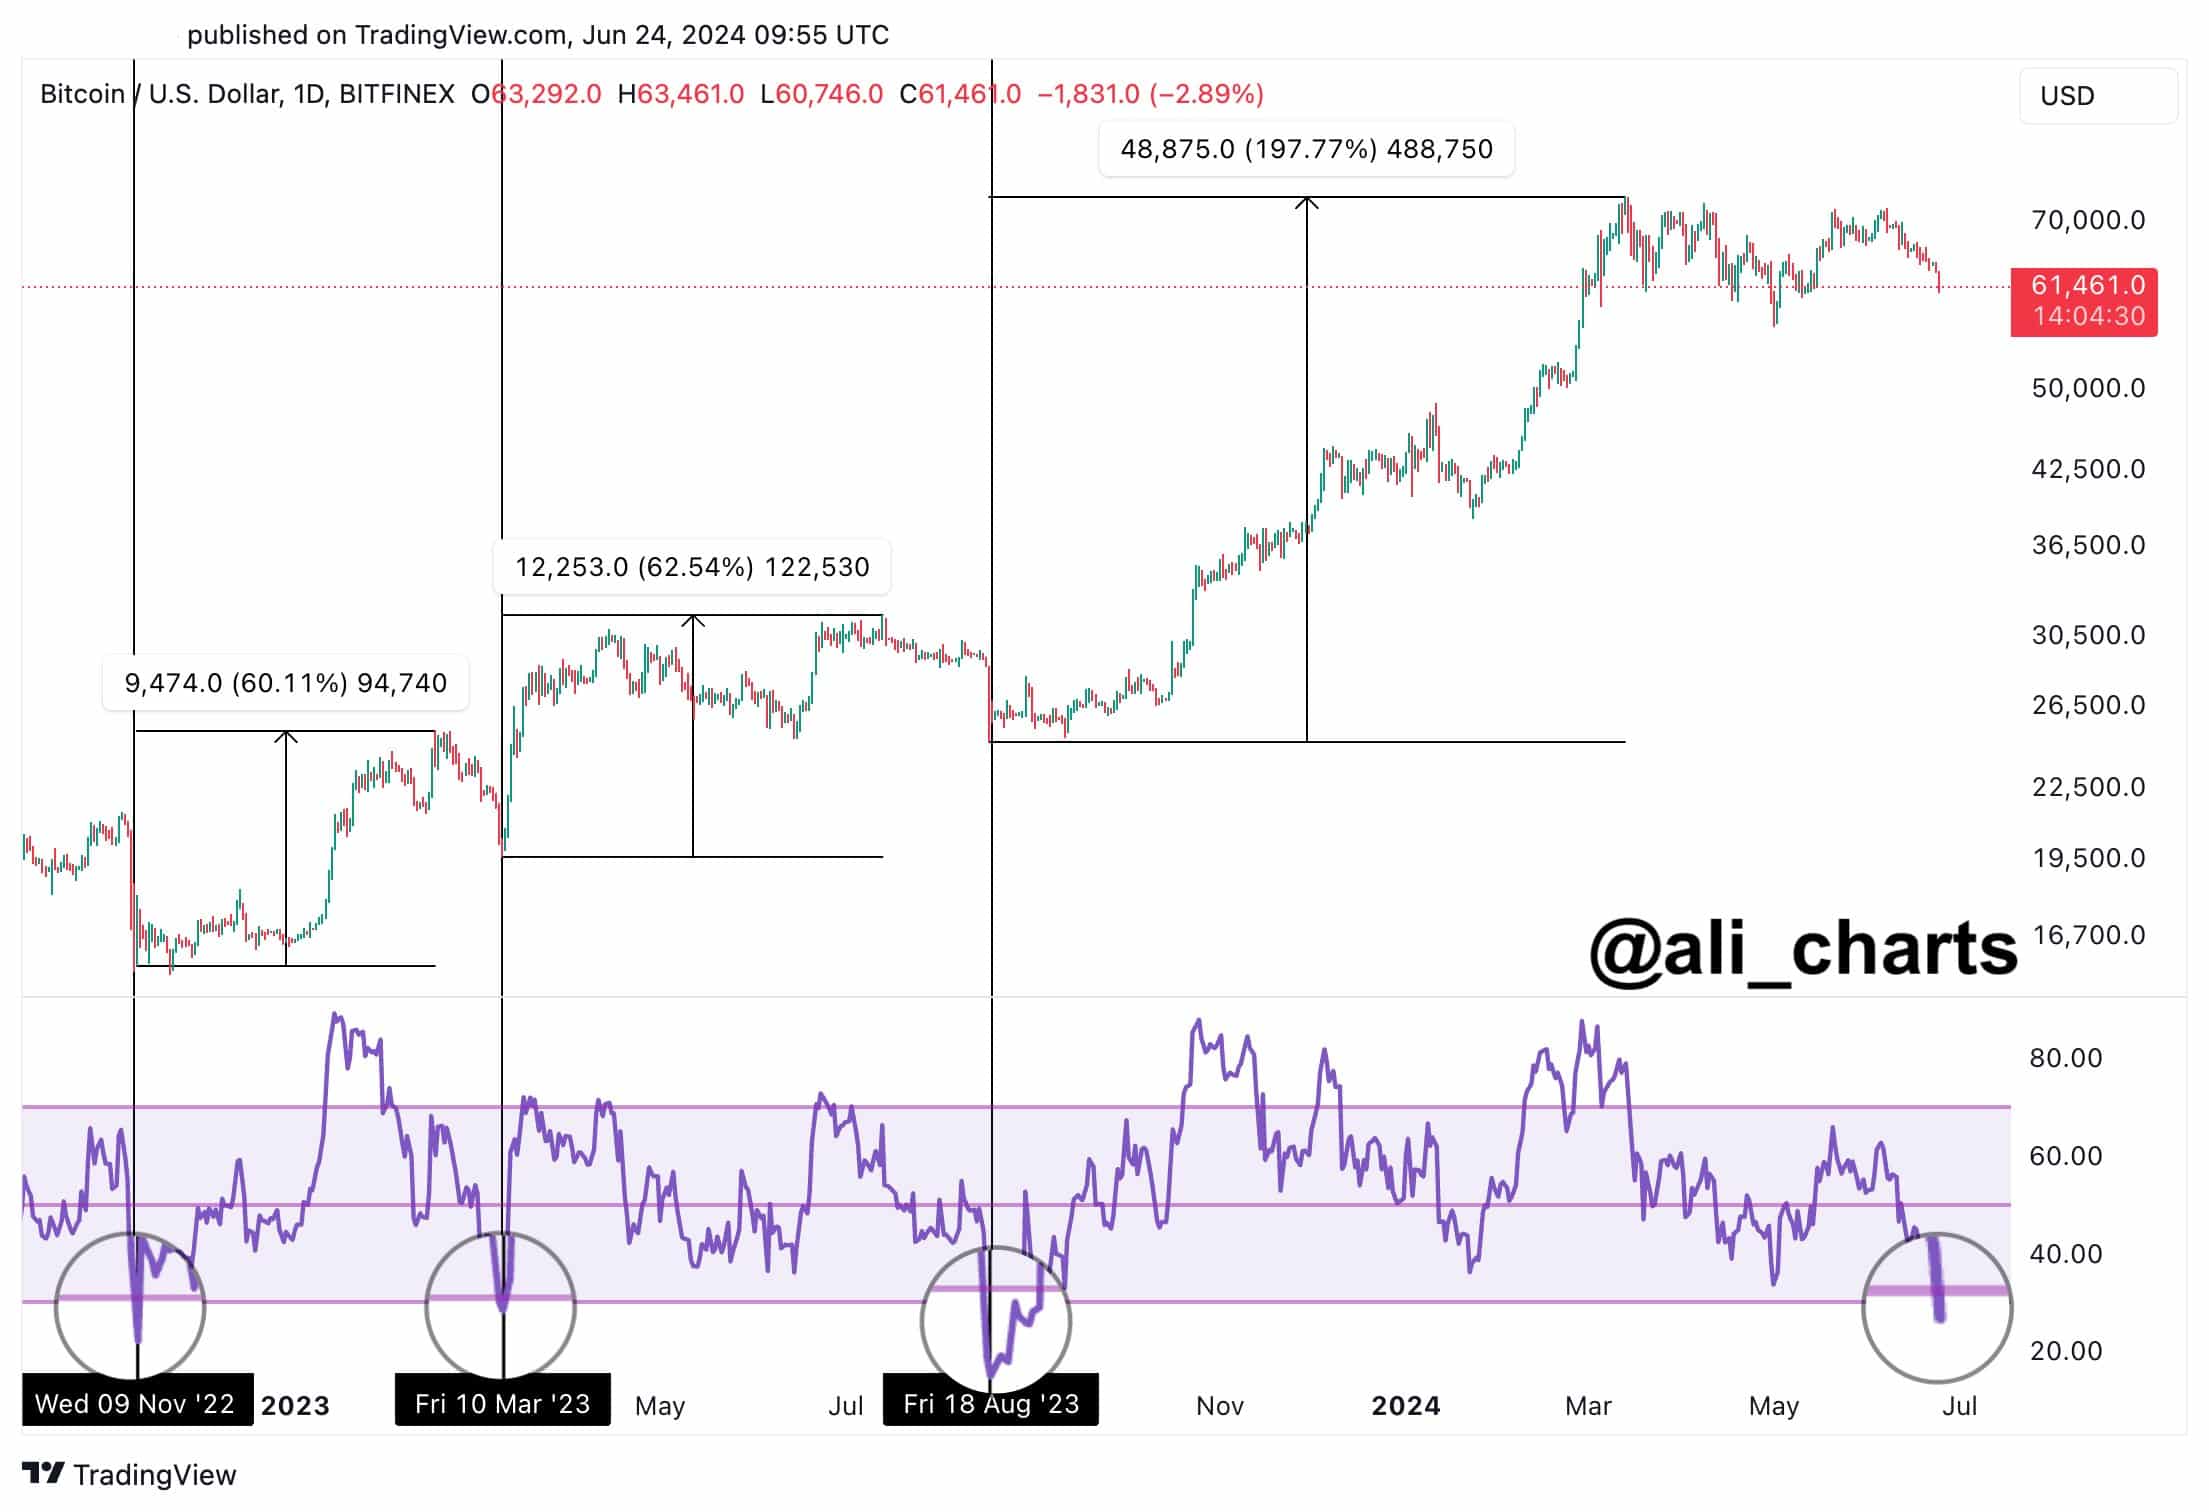
Another analyst, Ali Martinez, noted that the daily RSI was once more in the oversold region, below the 30 value. The previous three times it happened saw a subsequent recovery in Bitcoin prices measuring 60%, 63%, and 198%.
While this sounds reassuring, it does not imply that the downtrend is at an end, nor does it guarantee an uptrend is around the corner.
A violent move southward, potentially pushing below $60k in search of liquidity, before consolidation or recovery is anticipated in the coming weeks.
BTC futures market data shows bulls were going through much pain
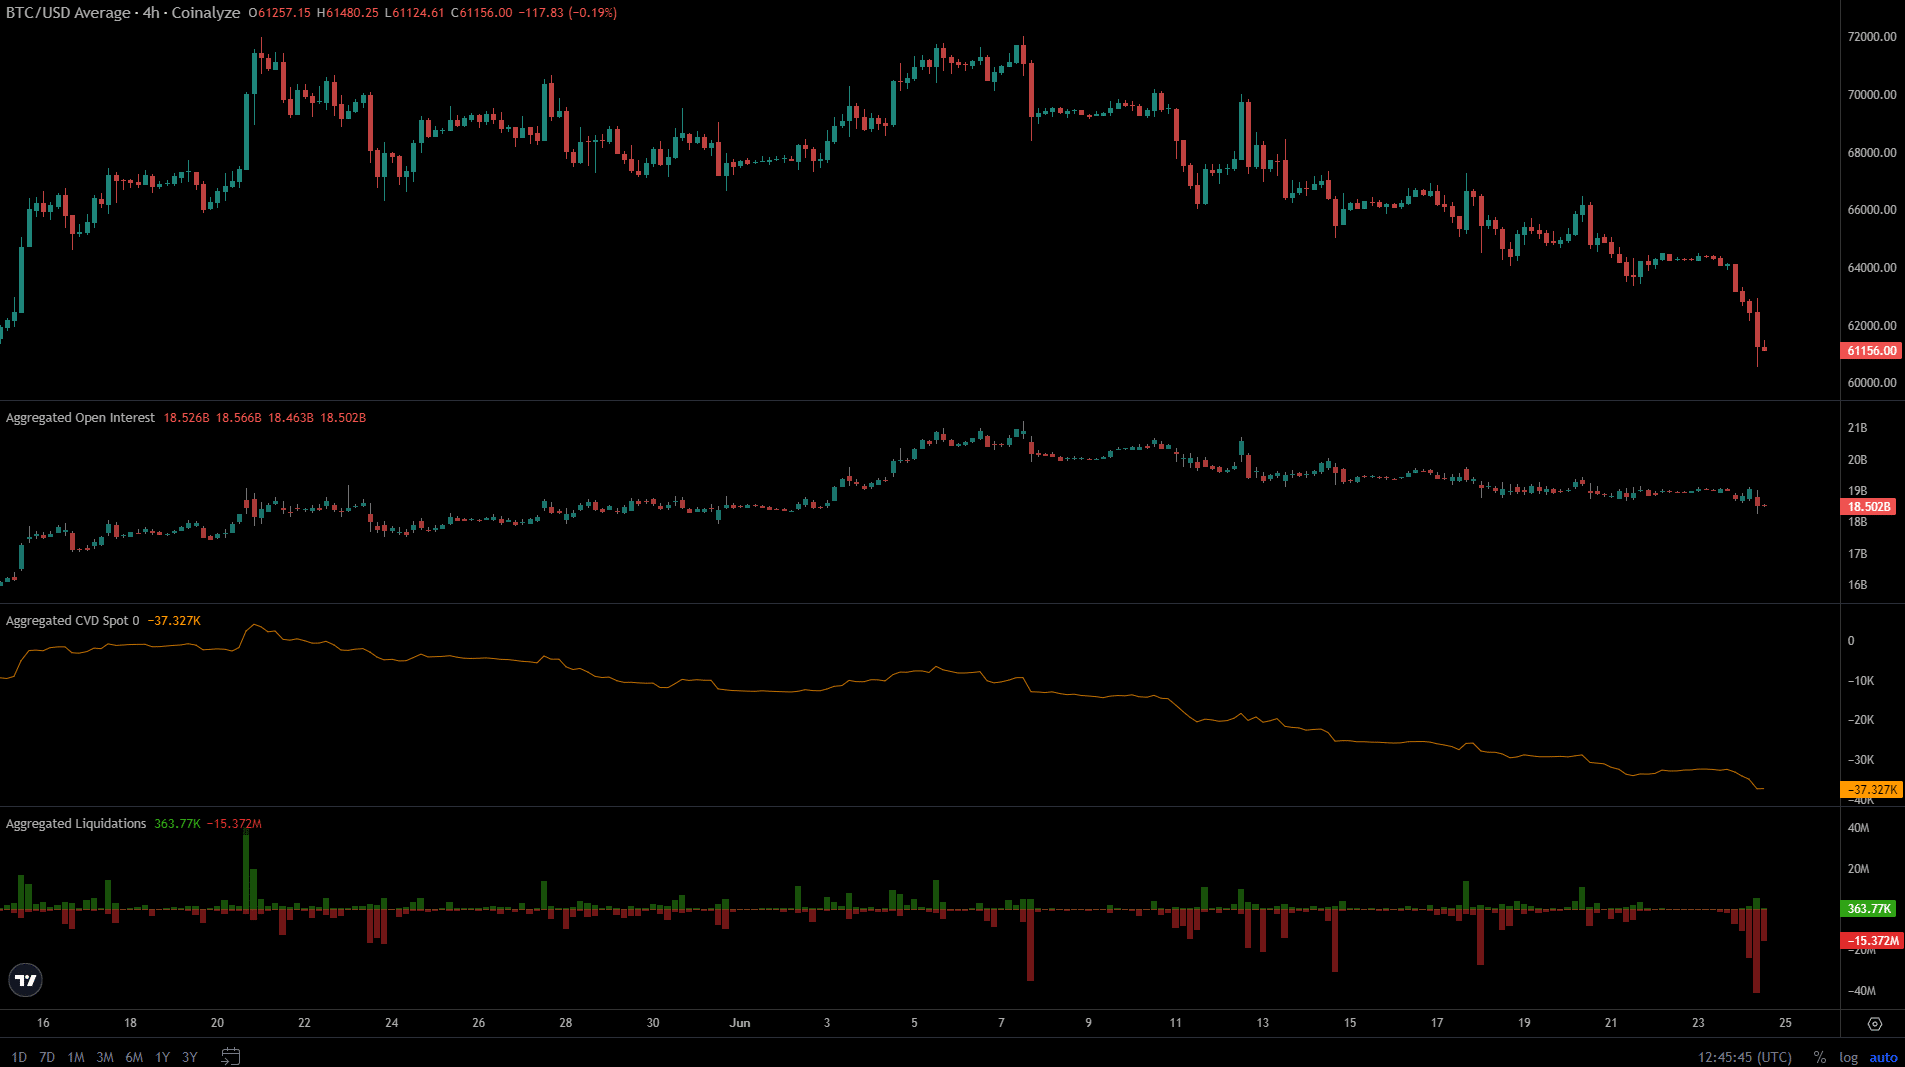
Data from Coinalyze showed that the spot CVD has steadily declined over the past month. This was a sign of selling pressure in the spot market and underlined Bitcoin’s weakness.
The Open Interest bounced higher in early June but after the first week, began to decline as well.
Together, it indicated bearish sentiment over the past three weeks. Futures traders were unwilling to bet on a BTC recovery and spot traders continued to sell their assets.
On top of this, sudden spikes of long liquidations pushed prices deeper and added to the stress on the bulls.
The past 24 hours also saw a flurry of long liquidations, with nearly $75 million in long liquidations in a 12-hour gap on the 24th of June based on Coinalyze data.
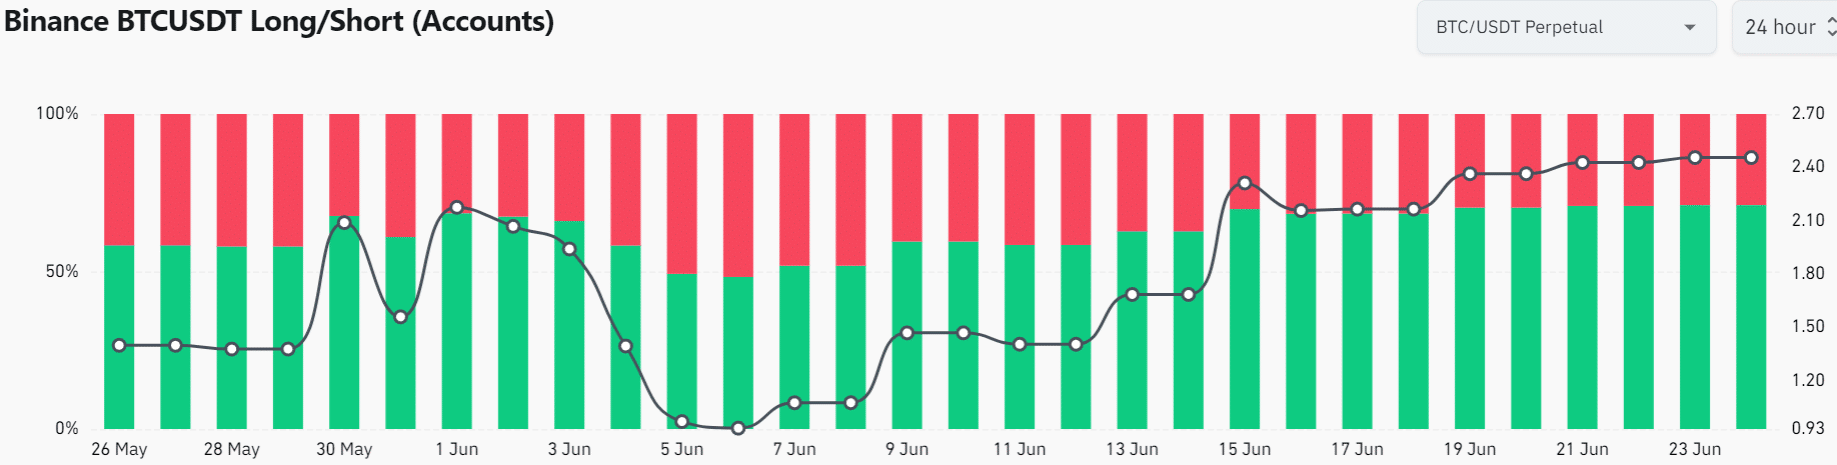
The long/short accounts ratio was at 2.46 at press time. This meant that there were 2.46 times as many accounts holding long positions as there were short positions.
In other words, smaller retail traders were betting on a Bitcoin bounce but the larger accounts continued to remain short.
Is your portfolio green? Check the Bitcoin Profit Calculator
Putting the pieces together, it appeared highly likely that Bitcoin bulls would continue to dance to the sellers’ tune over the next 2-4 weeks.
A sudden drop in prices is also possible given the daily RSI’s dive into the oversold territory.


