A test for Bitcoin bulls at $69K – What should you watch out for?
Bitcoin's mean coin age has not trended downward despite a price drop, showing BTC is not in a distribution phase yet.

- Bitcoin has had a bearish structure on the weekly and 3-day price charts.
- Technical indicators were mixed, but overall, prices are more likely to fall than trend higher.
Bitcoin [BTC] roared back to life after visiting the liquidity pool at the $64k zone. The price slump reversed within a few hours, and the $69k liquidity zone was the next short-term target.
So far, BTC is on track to achieve this.
In a post on X (formerly Twitter), IntoTheBlock noted that there was a strong netflow of BTC into exchanges. This could see a wave of selling and hints at a price reversal in the coming days.
Bearish market structure highlights trader bias
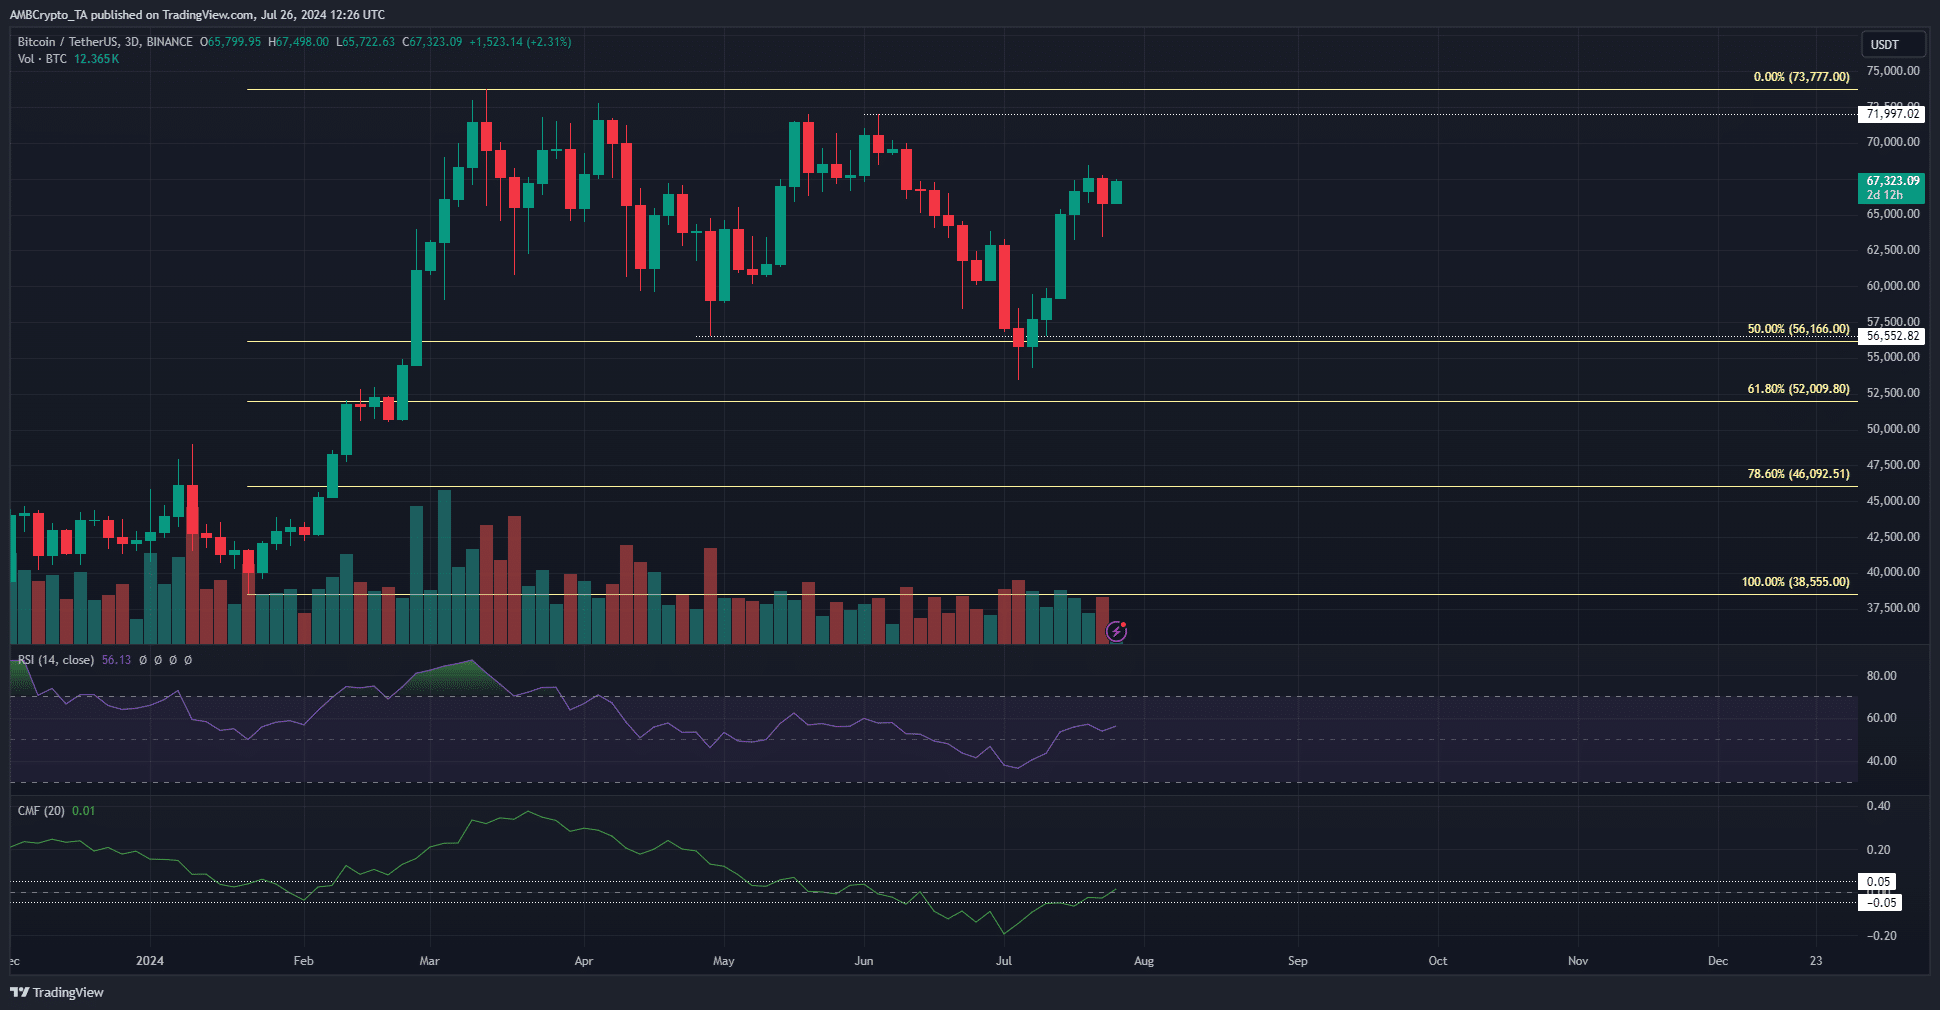
The 3-day price chart saw a session close below $56.5k on the 5th of July, forming a bearish structure break. The previous lower high at $72k remained unbeaten.
Based on an earlier analysis, the $69k liquidity pool is a place where a bearish reversal could occur soon.
The RSI on the 3-day chart was at 56 but did not show strong bullish momentum. It hinted that momentum might be shifting bullishly. However, the CMF was at +0.01 and does not reflect strong capital inflows.
Overall, the bias was bearish on the 3-day chart, but this can change if the $72k level is broken.
BTC speculators were eager to go long
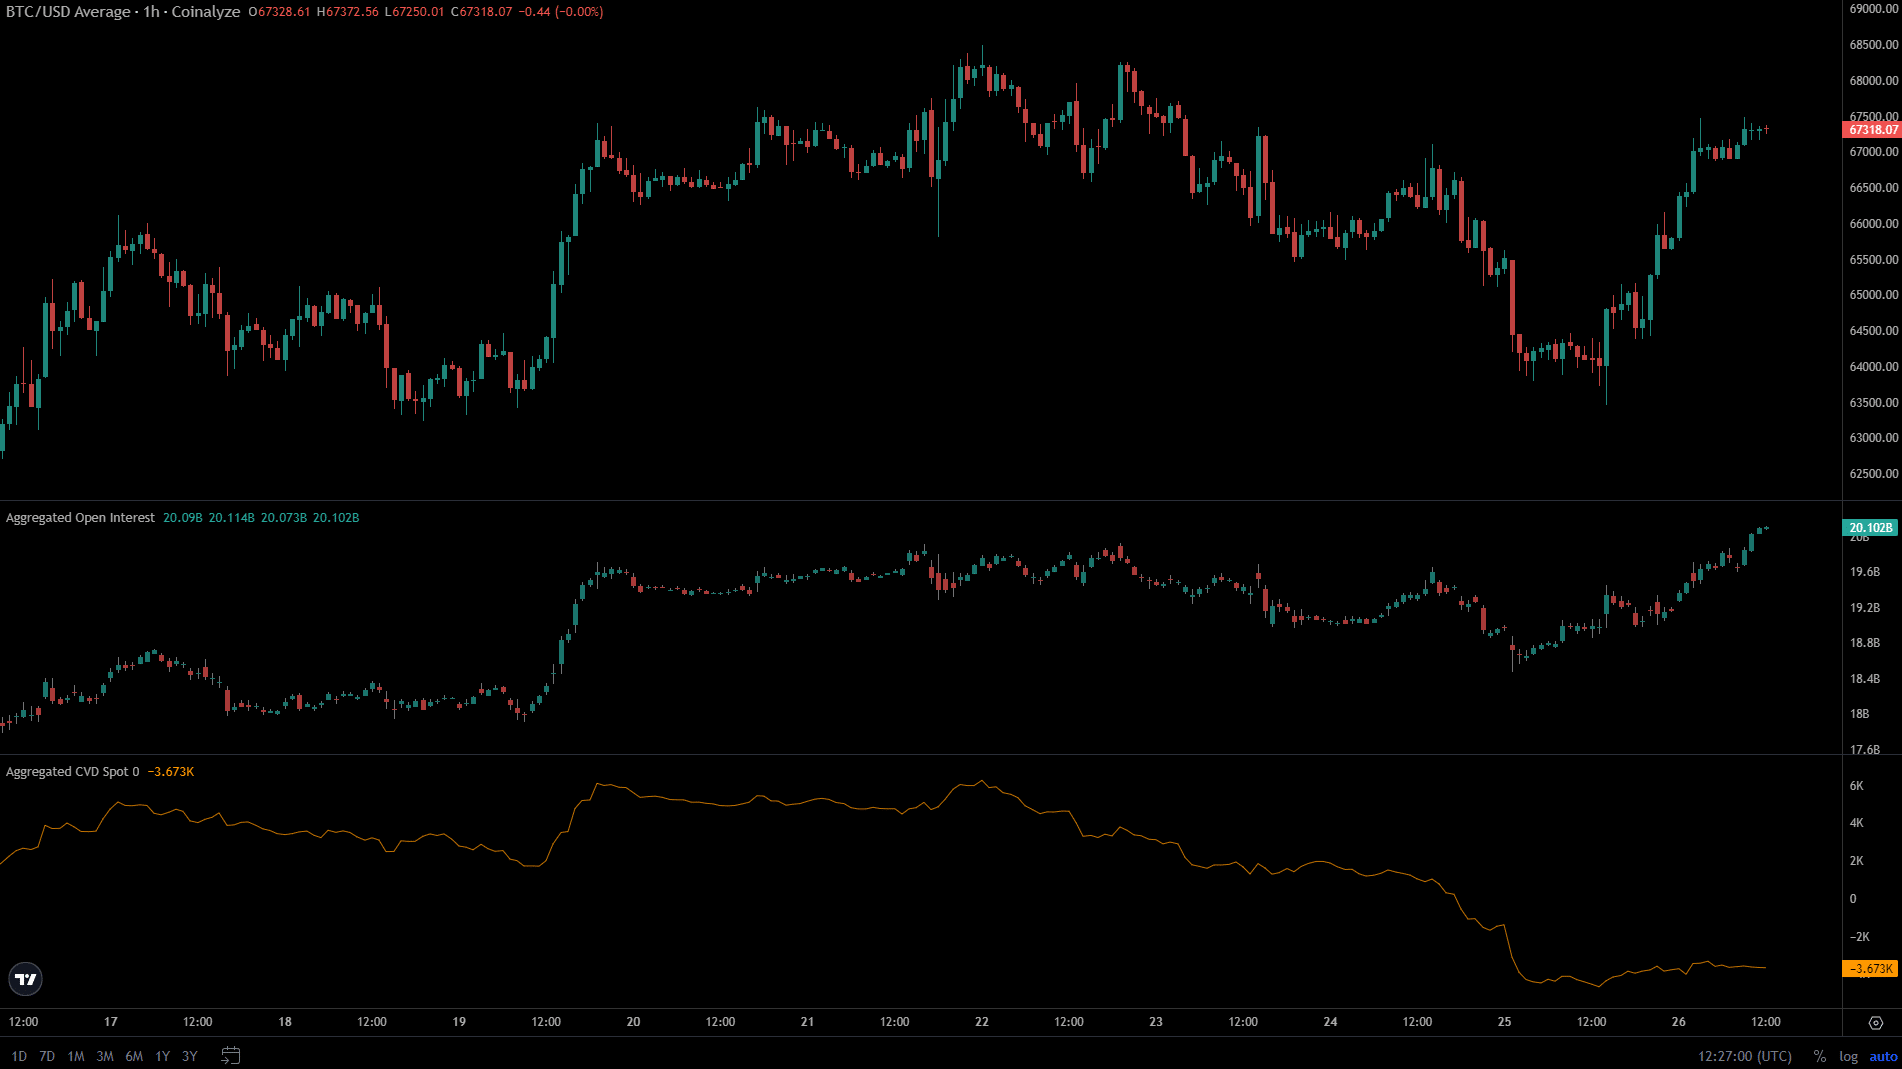
In the past 24 hours, the price reversal from $64k was accompanied by a sharp rise in Open Interest. It indicated strong bullish sentiment in the short-term and a sign of conviction among speculators of more gains.
On the other hand, the spot CVD was unable to establish an uptrend. This indicated a lack of buying pressure despite the price bounce and reinforced the idea of a bearish reversal.
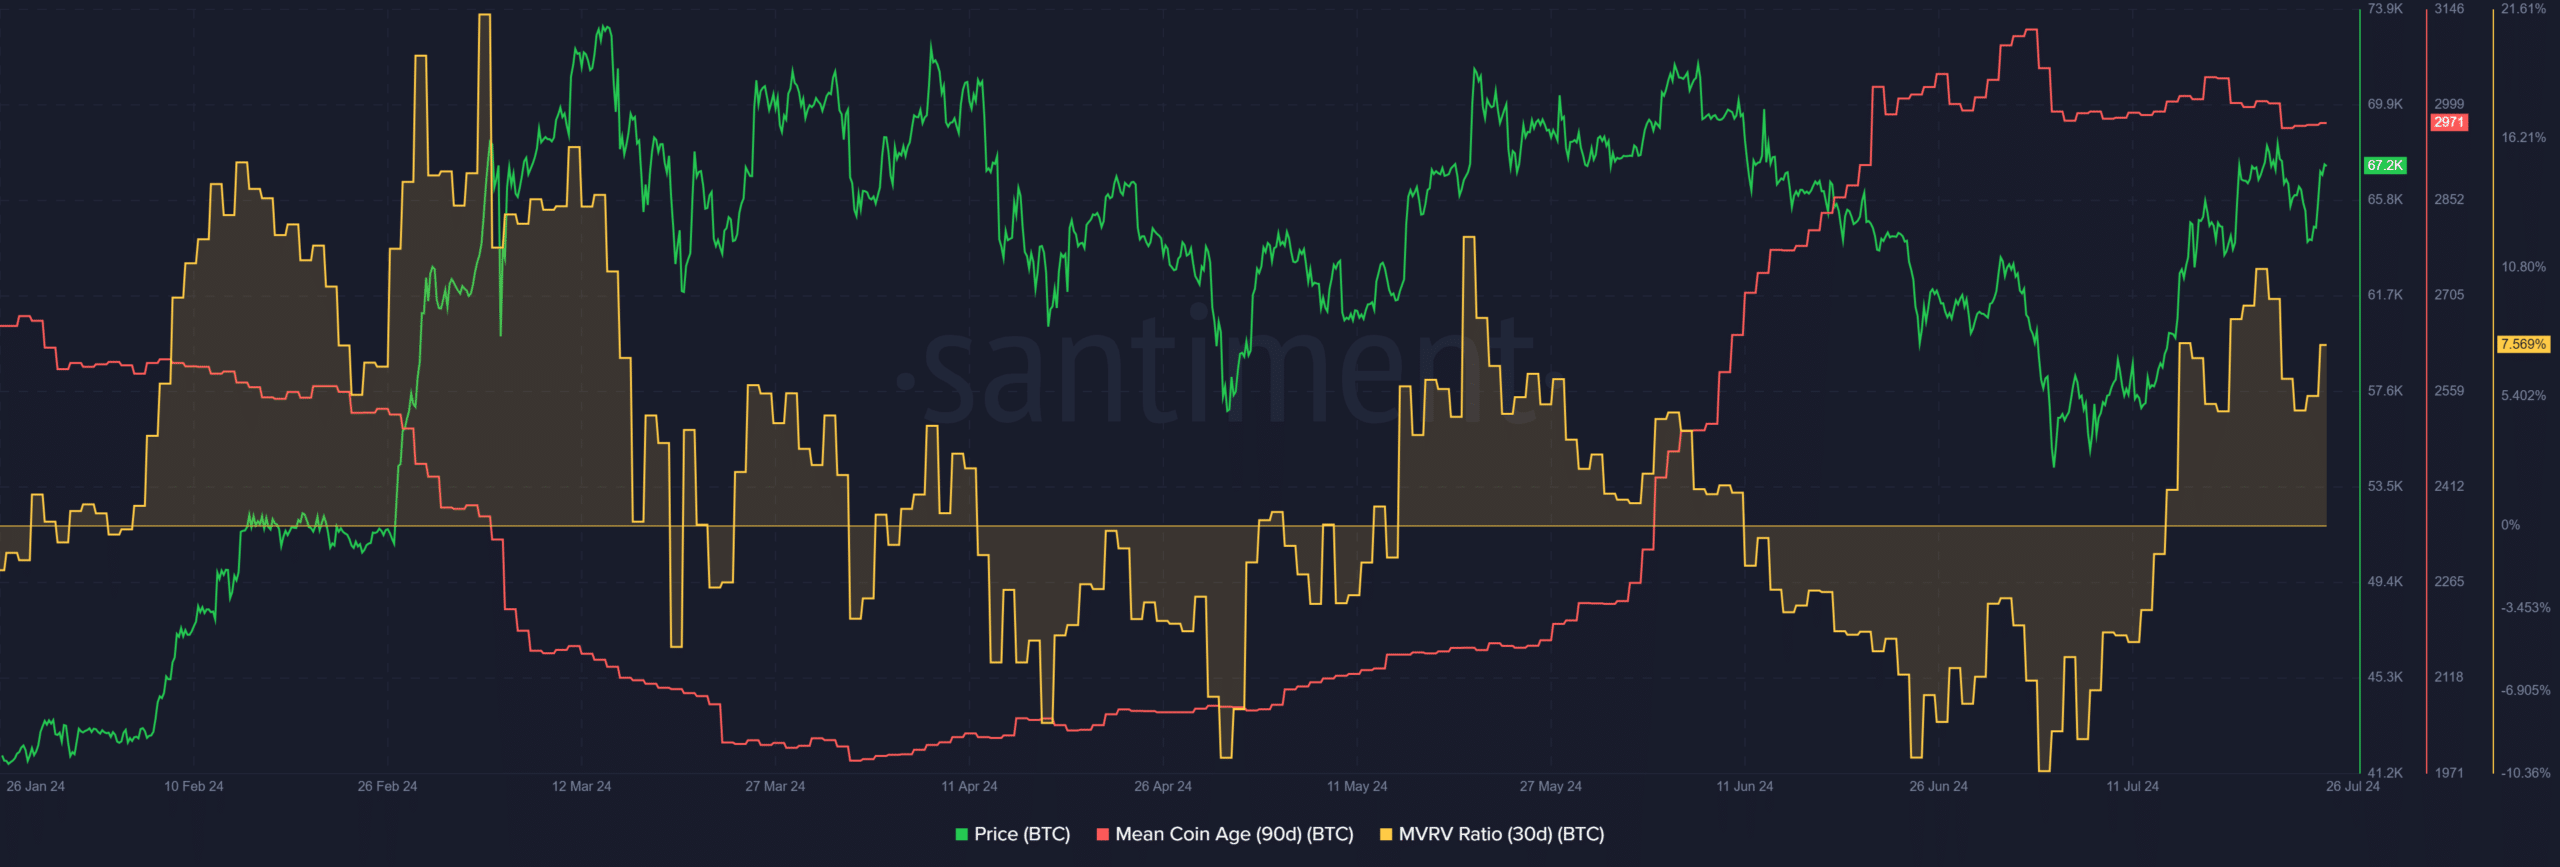
The 30-day MVRV was at 7.6%, showing short-term holders were at a modest profit. A continued increase in the MVRV would signal potential selling pressure in the form of profit-taking by the short-term holders.
The 90-day mean coin age (MCA) has not trended downward despite the price drop. It was a sign that holders were not willing to part with their BTC, which hinted at a continued bullish trend.
Read Bitcoin’s [BTC] Price Prediction 2024-25
Putting all the clues together, it appeared likely that Bitcoin would see a reversal around the $69k zone. If the MCA begins to fall, it would reinforce this idea.
Instead, if the MCA and the spot CVD trend upward again, it would be a clue that BTC bulls were strong enough to drive prices past the $69k liquidity pool.
Disclaimer: The information presented does not constitute financial, investment, trading, or other types of advice and is solely the writer’s opinion.