Solana: Key metrics have the answer why SOL may never break its ATH
Solana's inability to break its ATH coupled with high inflation rate and low real trading volume suggests potential future crashes.
- Venture capitals continue to inflate supply of SOL.
- Solana’s weak financial statement raises questions on SOL’s long-term dynamics.
Solana [SOL] may never break its all-time high of $260 which it hit in November, 2021. Investors buying more SOL fear losing their investment as venture capitals continue to inflate the supply by printing new tokens.
The circulating supply when SOL hit ATH was 301 million, but three years later, 161 million more tokens have been added.
Since August 2023, 60 million SOL have been added, resulting in a 15% annual inflation rate.
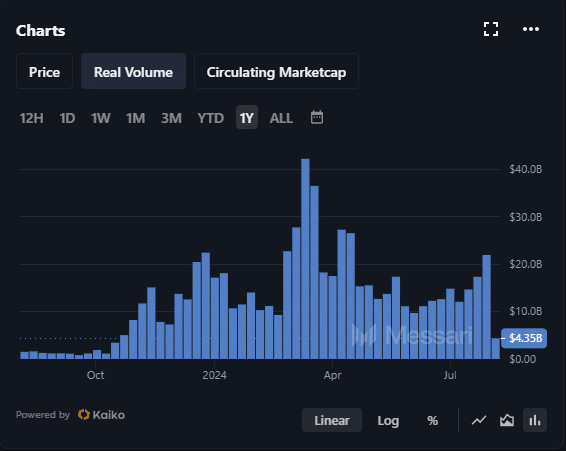
With real trading volume at its lowest in five years according to Messari metrics, Solana is likely to crash, as indicated by previous AMBCrypto research.
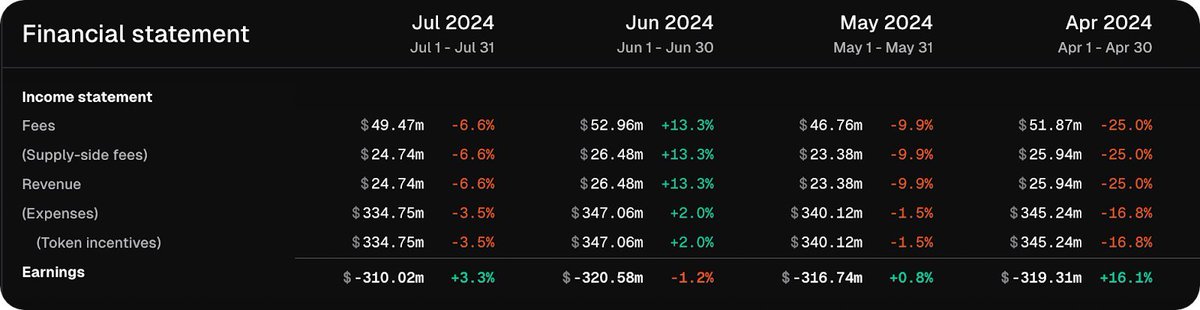
Negative earnings plunge Solana deep into the red
Moreover, market analyst Duo Nine noted on X, formerly Twitter, that Solana has incurred a net loss of $2.53 billion over the past four quarters according to data from Bankless, erasing its revenue and plunging into the abyss.
This financial strain emphasizes on the unsustainable nature of Solana’s current economic model.
Duo Nine suggested that SOL may never break its all-time high due to a high inflation rate.
Further investments are increasingly risky as the mounting losses and inflationary pressures could jeopardize Solana’s long-term viability and market performance.
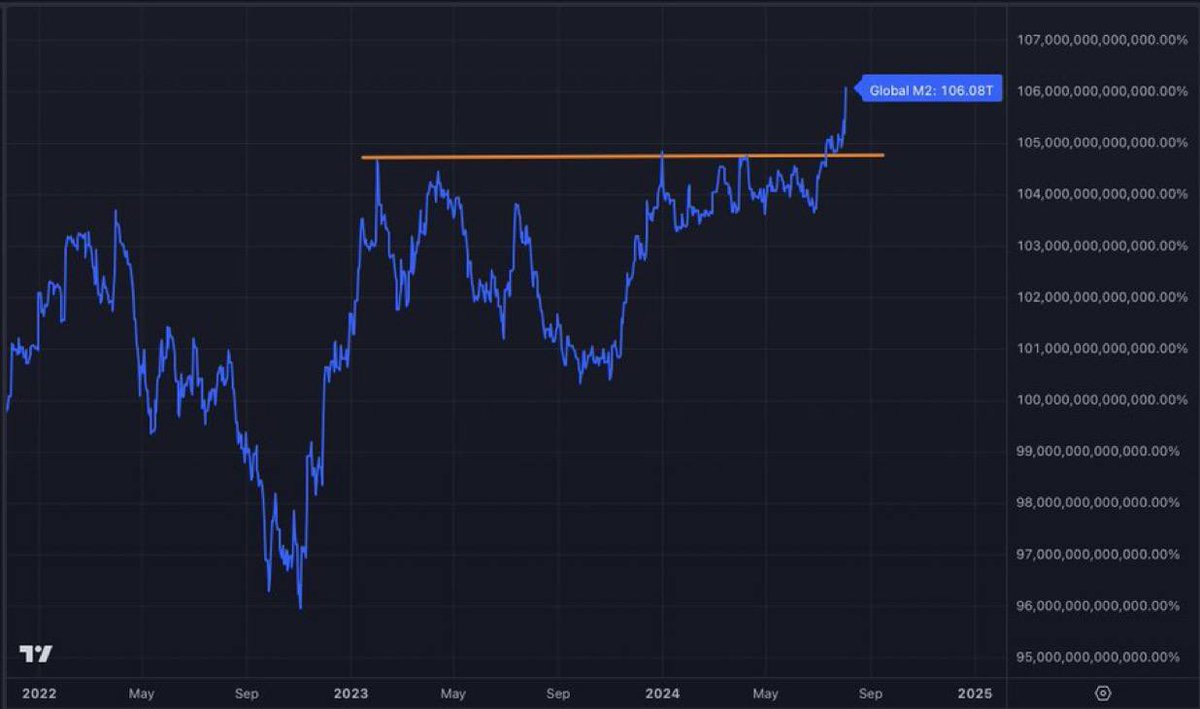
SOL price after global M2 money supply hit ATH suggests bearish sentiment
The global M2 money supply has reached a record high, flooding the economy with money as the TradingView chart denotes.
This increased liquidity generally boosts crypto prices as the value of money drops.
Despite this trend, Solana (SOL) did not hit new all-time highs like Bitcoin (BTC). This gap suggests SOL is set for significant market decline.
While BTC thrived with the extra money, SOL’s failure to rise similarly points to possible problems or market conditions that could limit its growth compared to other cryptocurrencies.
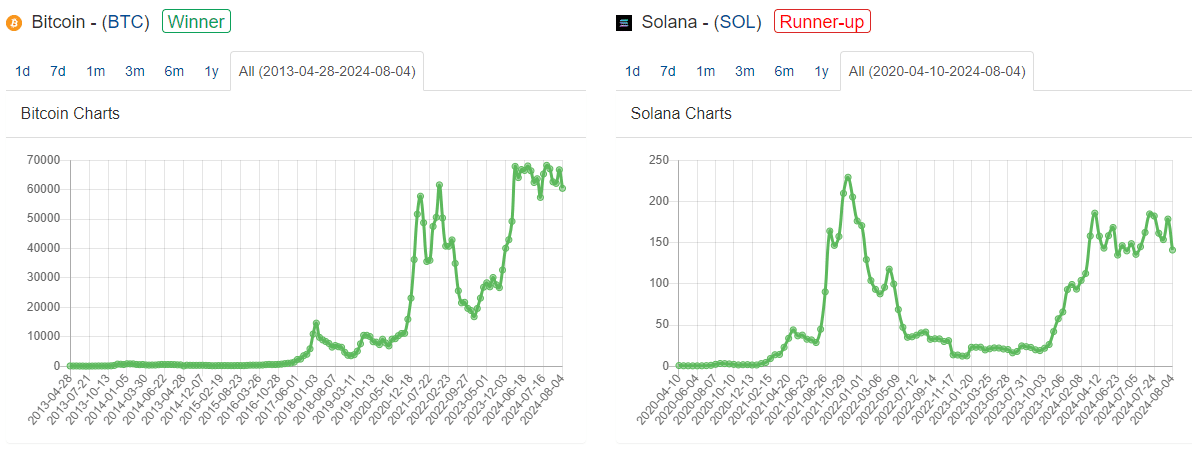
All-time BTC v SOL chart comparison
Further the charts provide objective insights, showing that Solana likely peaked this cycle while many remain unaware.
Bitcoin hit a new all-time high, but Solana didn’t surpass its previous peak as Walletinvestor.com comparison chart indicated.
This difference highlights Solana’s struggles despite the market’s overall bullish trend.
Realistic or not, here’s SOL’s market cap in BTC’s terms
Bitcoin’s rise emphasizes its dominance, while Solana’s failure to reach new heights suggests underlying issues or lower demand.
Investors should heed the charts, as Solana’s performance indicates it may not match Bitcoin’s success in the current cycle.