Predicting the crypto week ahead: Will Bitcoin bottom and Ethereum cross $3,300?

- Bitcoin’s might target $61k first this week as accumulation was rising.
- A bullish pattern appeared on ETH’s daily chart, indicating a price rise.
The past week wasn’t quite volatile, as most cryptos were in a consolidating pattern, witnessing simply single-digit movements
However, Toncoin [TON] decoupled from the market as its price increased by more than 13% during the last seven days.
What does the crypto week ahead hold?
The crypto week ahead might look a bit different, though. At the time of writing, the Fear and Greed Index had a reading of 28, meaning that the market was in a “fear” phase.
This indicated a rise in volatility in the coming days towards the north.
Bitcoin and Ethereum’s weekly targets
CoinMarketCap’s data revealed that Bitcoin’s [BTC] price had moved marginally last week. At press time, it was trading at $58,630.
However, Ethereum’s [ETH] price witnessed a 23% weekly surge. At the time of writing, the king of altcoins was trading at $2,630.
AMBCrypto then planned to assess BTC and ETH’s metrics and daily charts to find out their upcoming targets.
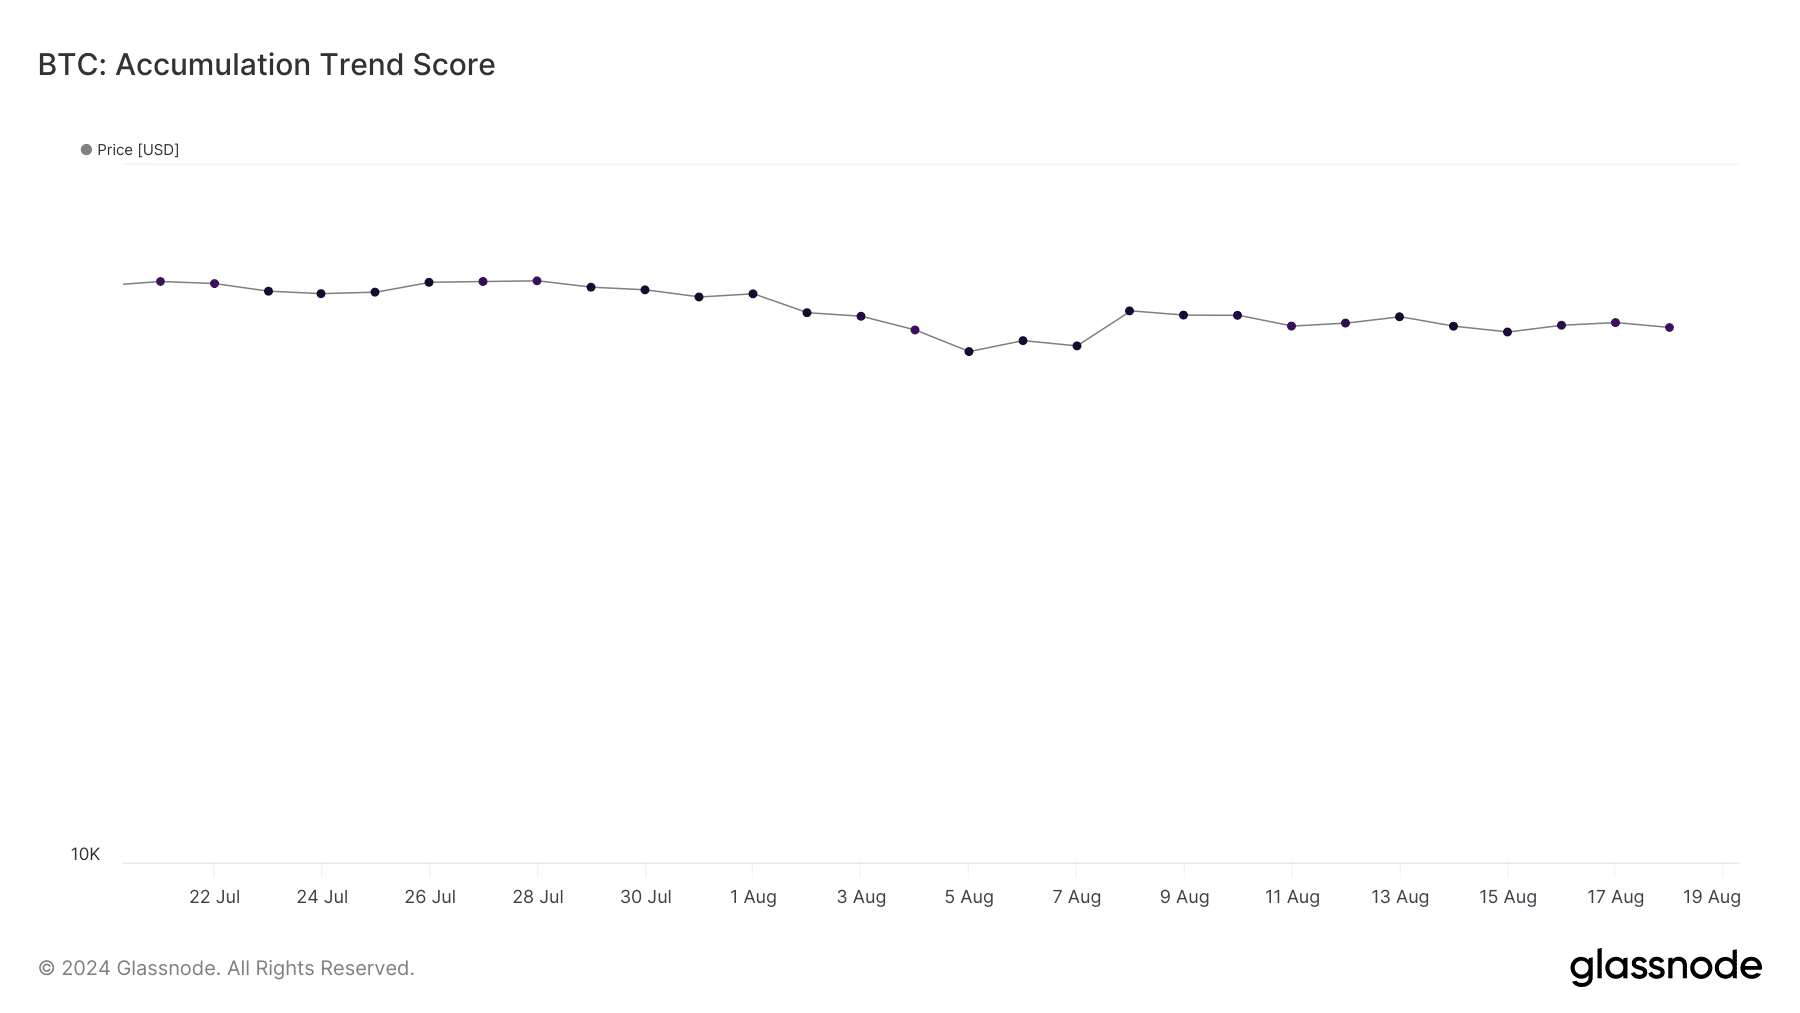
Beginning with BTC, its exchange reserve was dropping at press time, meaning that selling pressure was low. Its accumulation trend score had a value above 0.7.
For the uninitiated, a number closer to 1 indicates that buying pressure is dominant in the market.
However, CryptoQuant’s data revealed that BTC’s aSORP was red. This suggested that more investors were selling at a profit. In the middle of a bull market, it can indicate a market top.
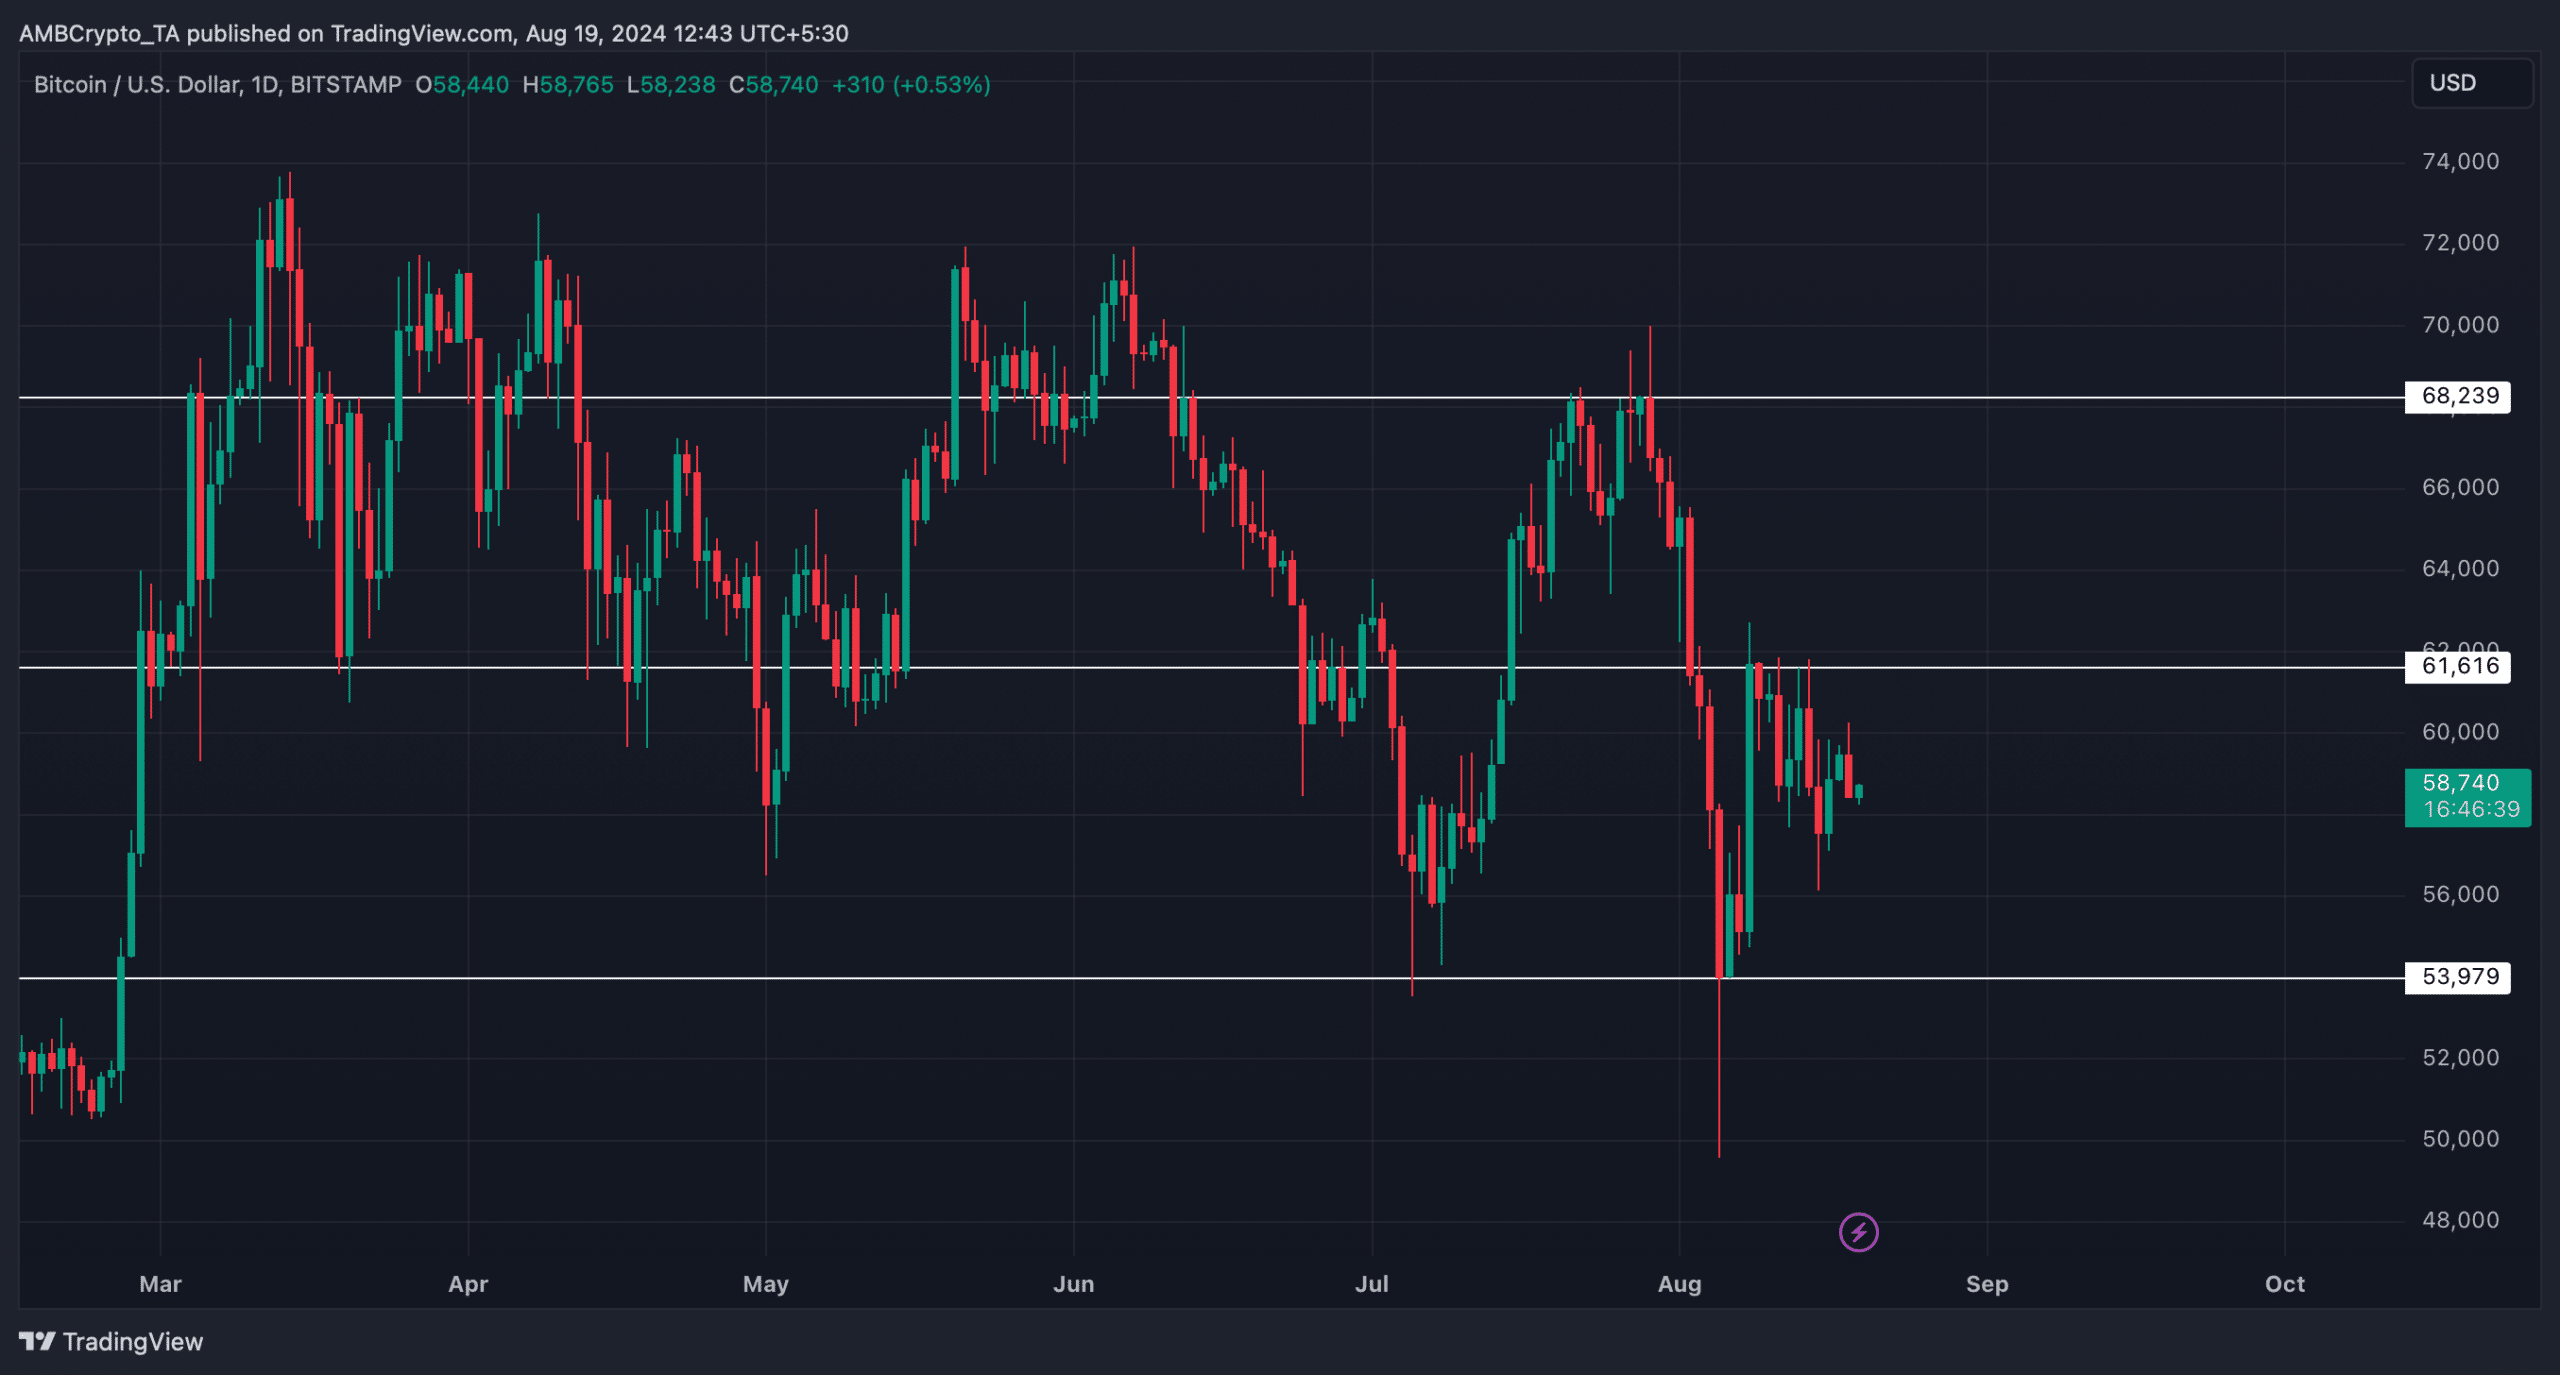
AMBCrypto’s look at BTC’s daily chart revealed that if the bulls gear up, then it would be crucial for BTC to go above $61k this week. A successful breakout above it would allow BTC to target $68k.
However, in case of a price drop, BTC might plummet to its support at $54k.
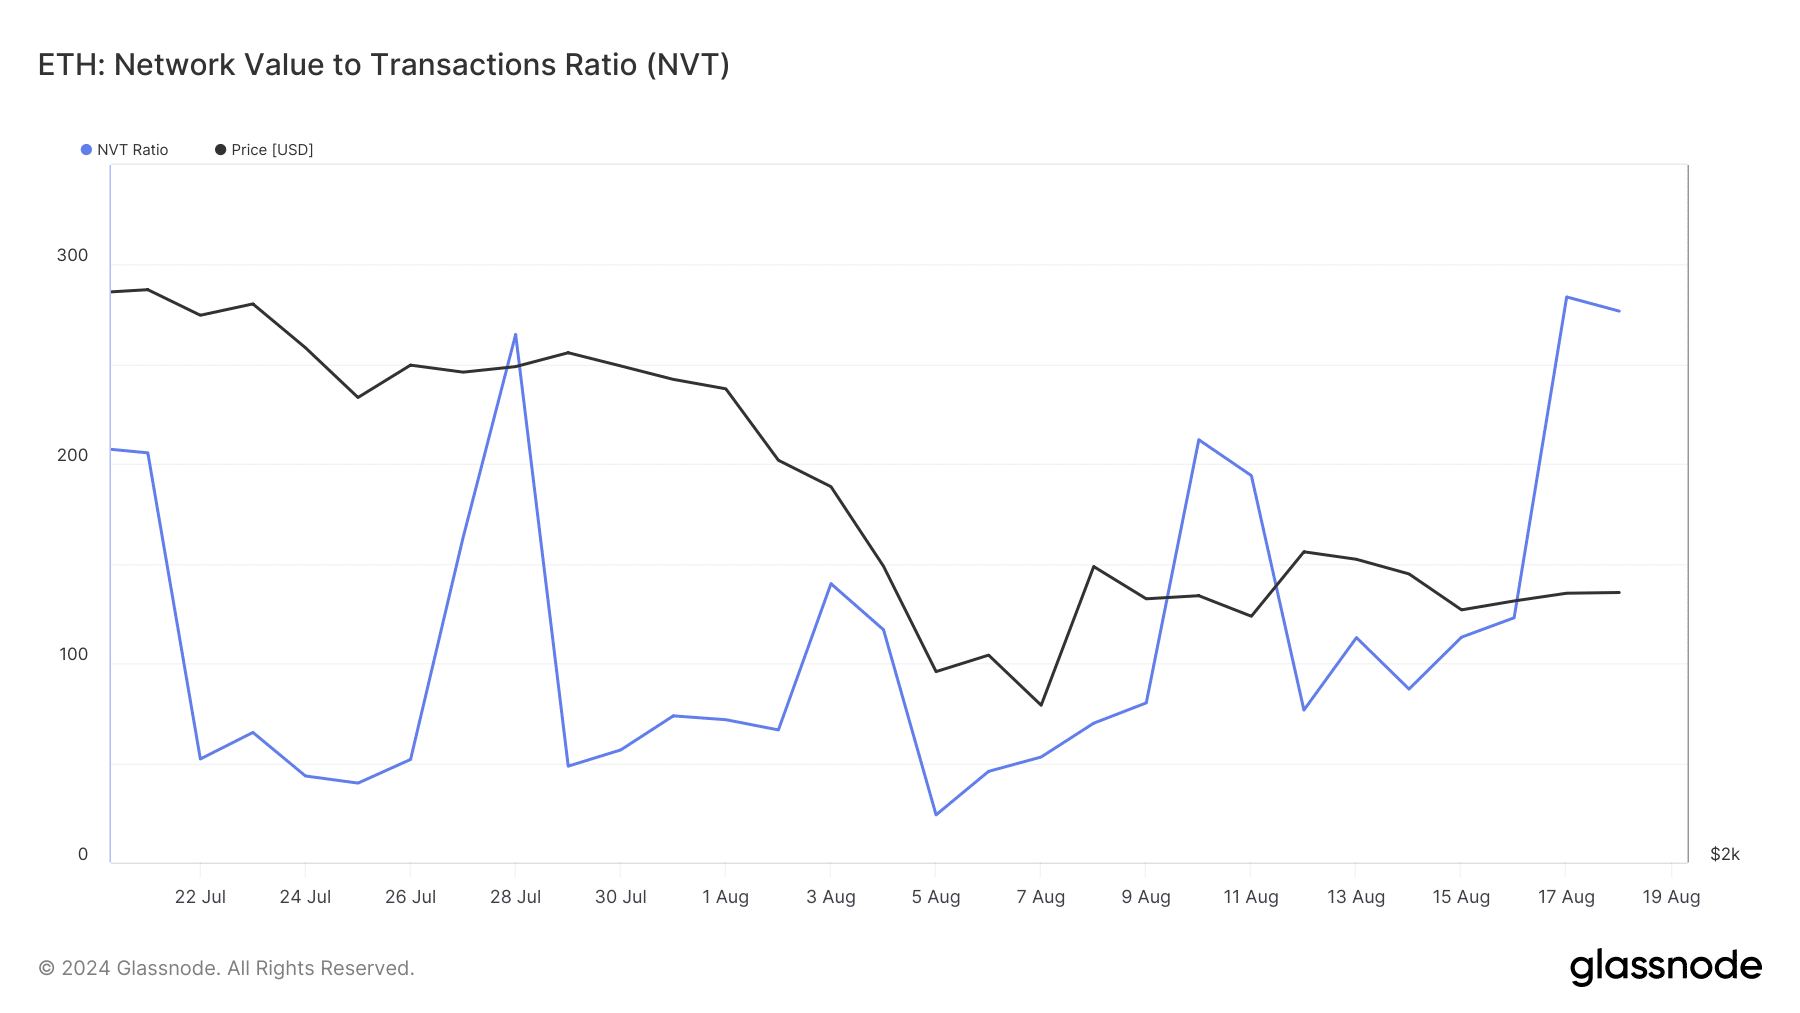
When it came to Ethereum, AMBCrypto’s examination of Glassnode’s data pointed out a sharp increase in ETH’s NVT ratio. Usually, this indicates that an asset is overvalued, indicating a price correction.
Nonetheless, ETH’s exchange reserve was also dropping, suggesting weak selling pressure.
Read Ethereum’s [ETH] Price Prediction 2024-2025
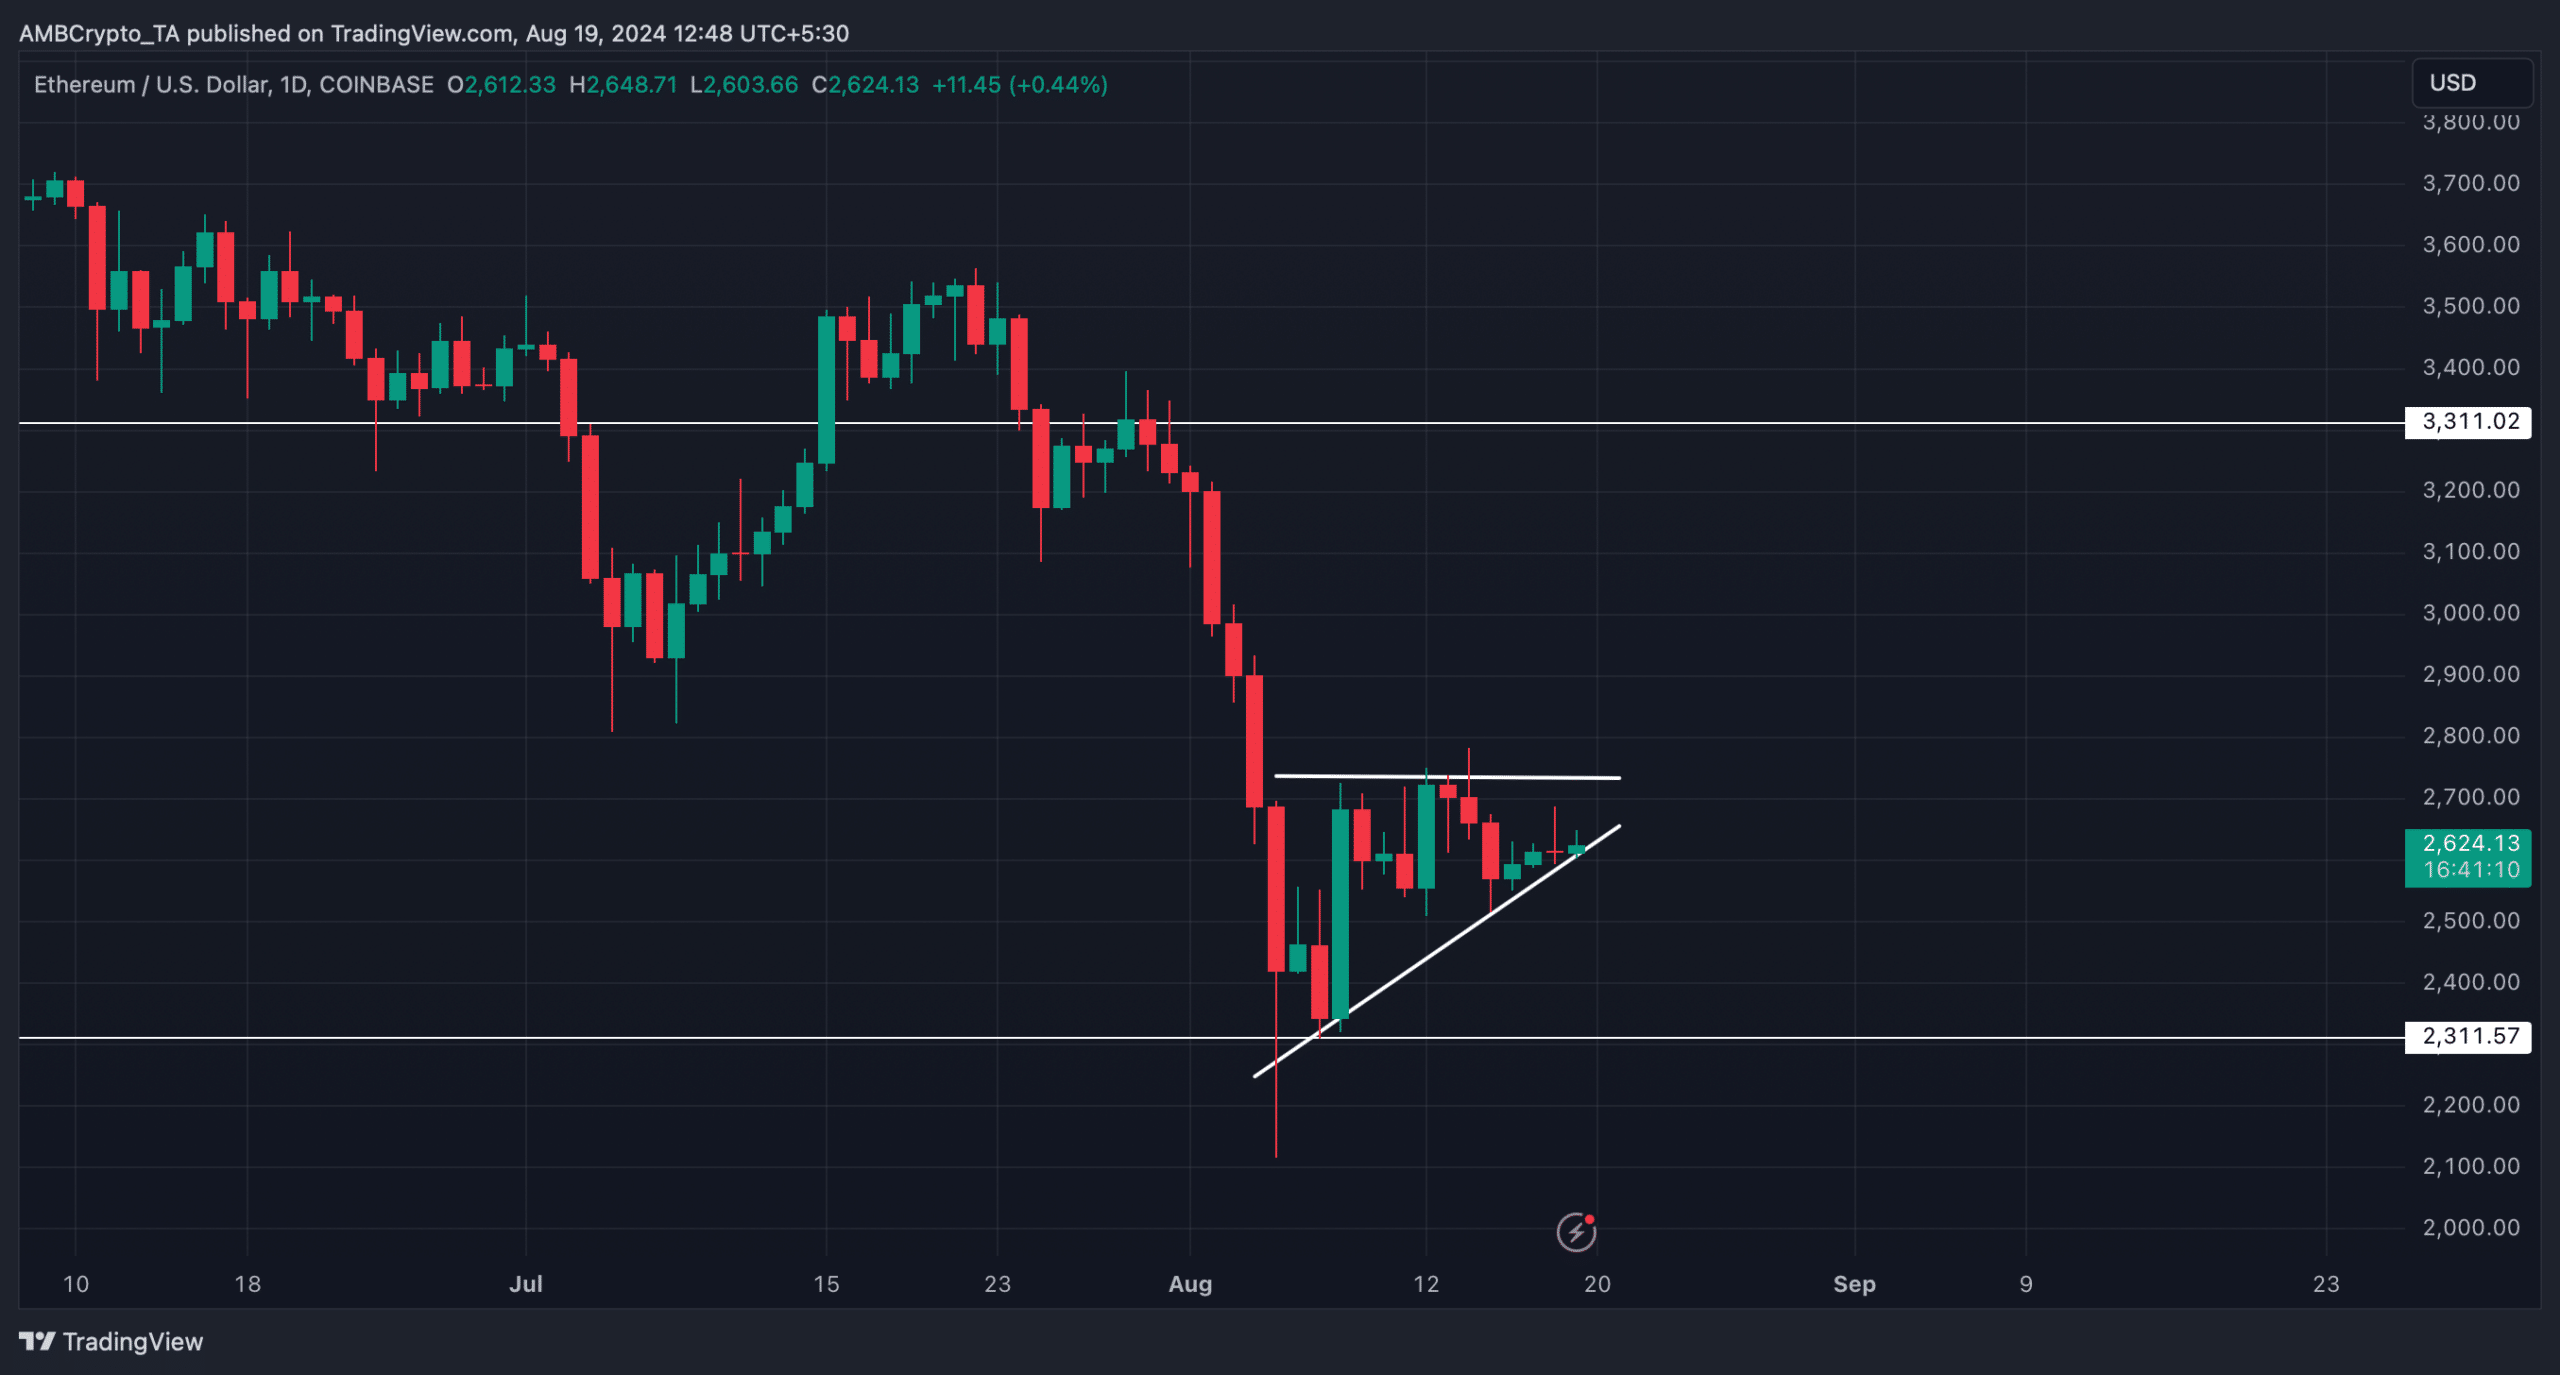
Upon closer inspection, AMBCrypto also found a bullish ascending triangle pattern on ETH’s daily chart.
In case of a bullish breakout, ETH might begin its recovery phase and reach $3.3k in the coming days of the week. However, if ETH faces rejection at $2,736, the token might as well drop to $2.3 again.


