Aptos: Could THIS be a make-or-break moment for APT traders?
APT's recent consolidation reaffirmed a rather weak trend on its chart, here's how you can capitalize on its recent price movements.

- APT was at a make-or-break moment, with price action nearing a critical support level at $5.5.
- The derivates data showed mixed sentiment, with bulls still needing a decisive close above the 20-day EMA to reclaim the near-term edge.
Aptos [APT] has been on a sideways trajectory for nearly three months. At press time, the altcoin traded near a crucial support range of $5.5-$5.7. The bears have tested this level repeatedly, and any close below it could trigger a deeper correction in APT’s price.
APT struggled to close above 20-day and 50-day EMAs and exhibited a strong near-term bearish edge. A decisive move from the $5.7 support could pave the way for its upcoming trend.
APT’s price wobbles at a critical support level—will it bounce or break?
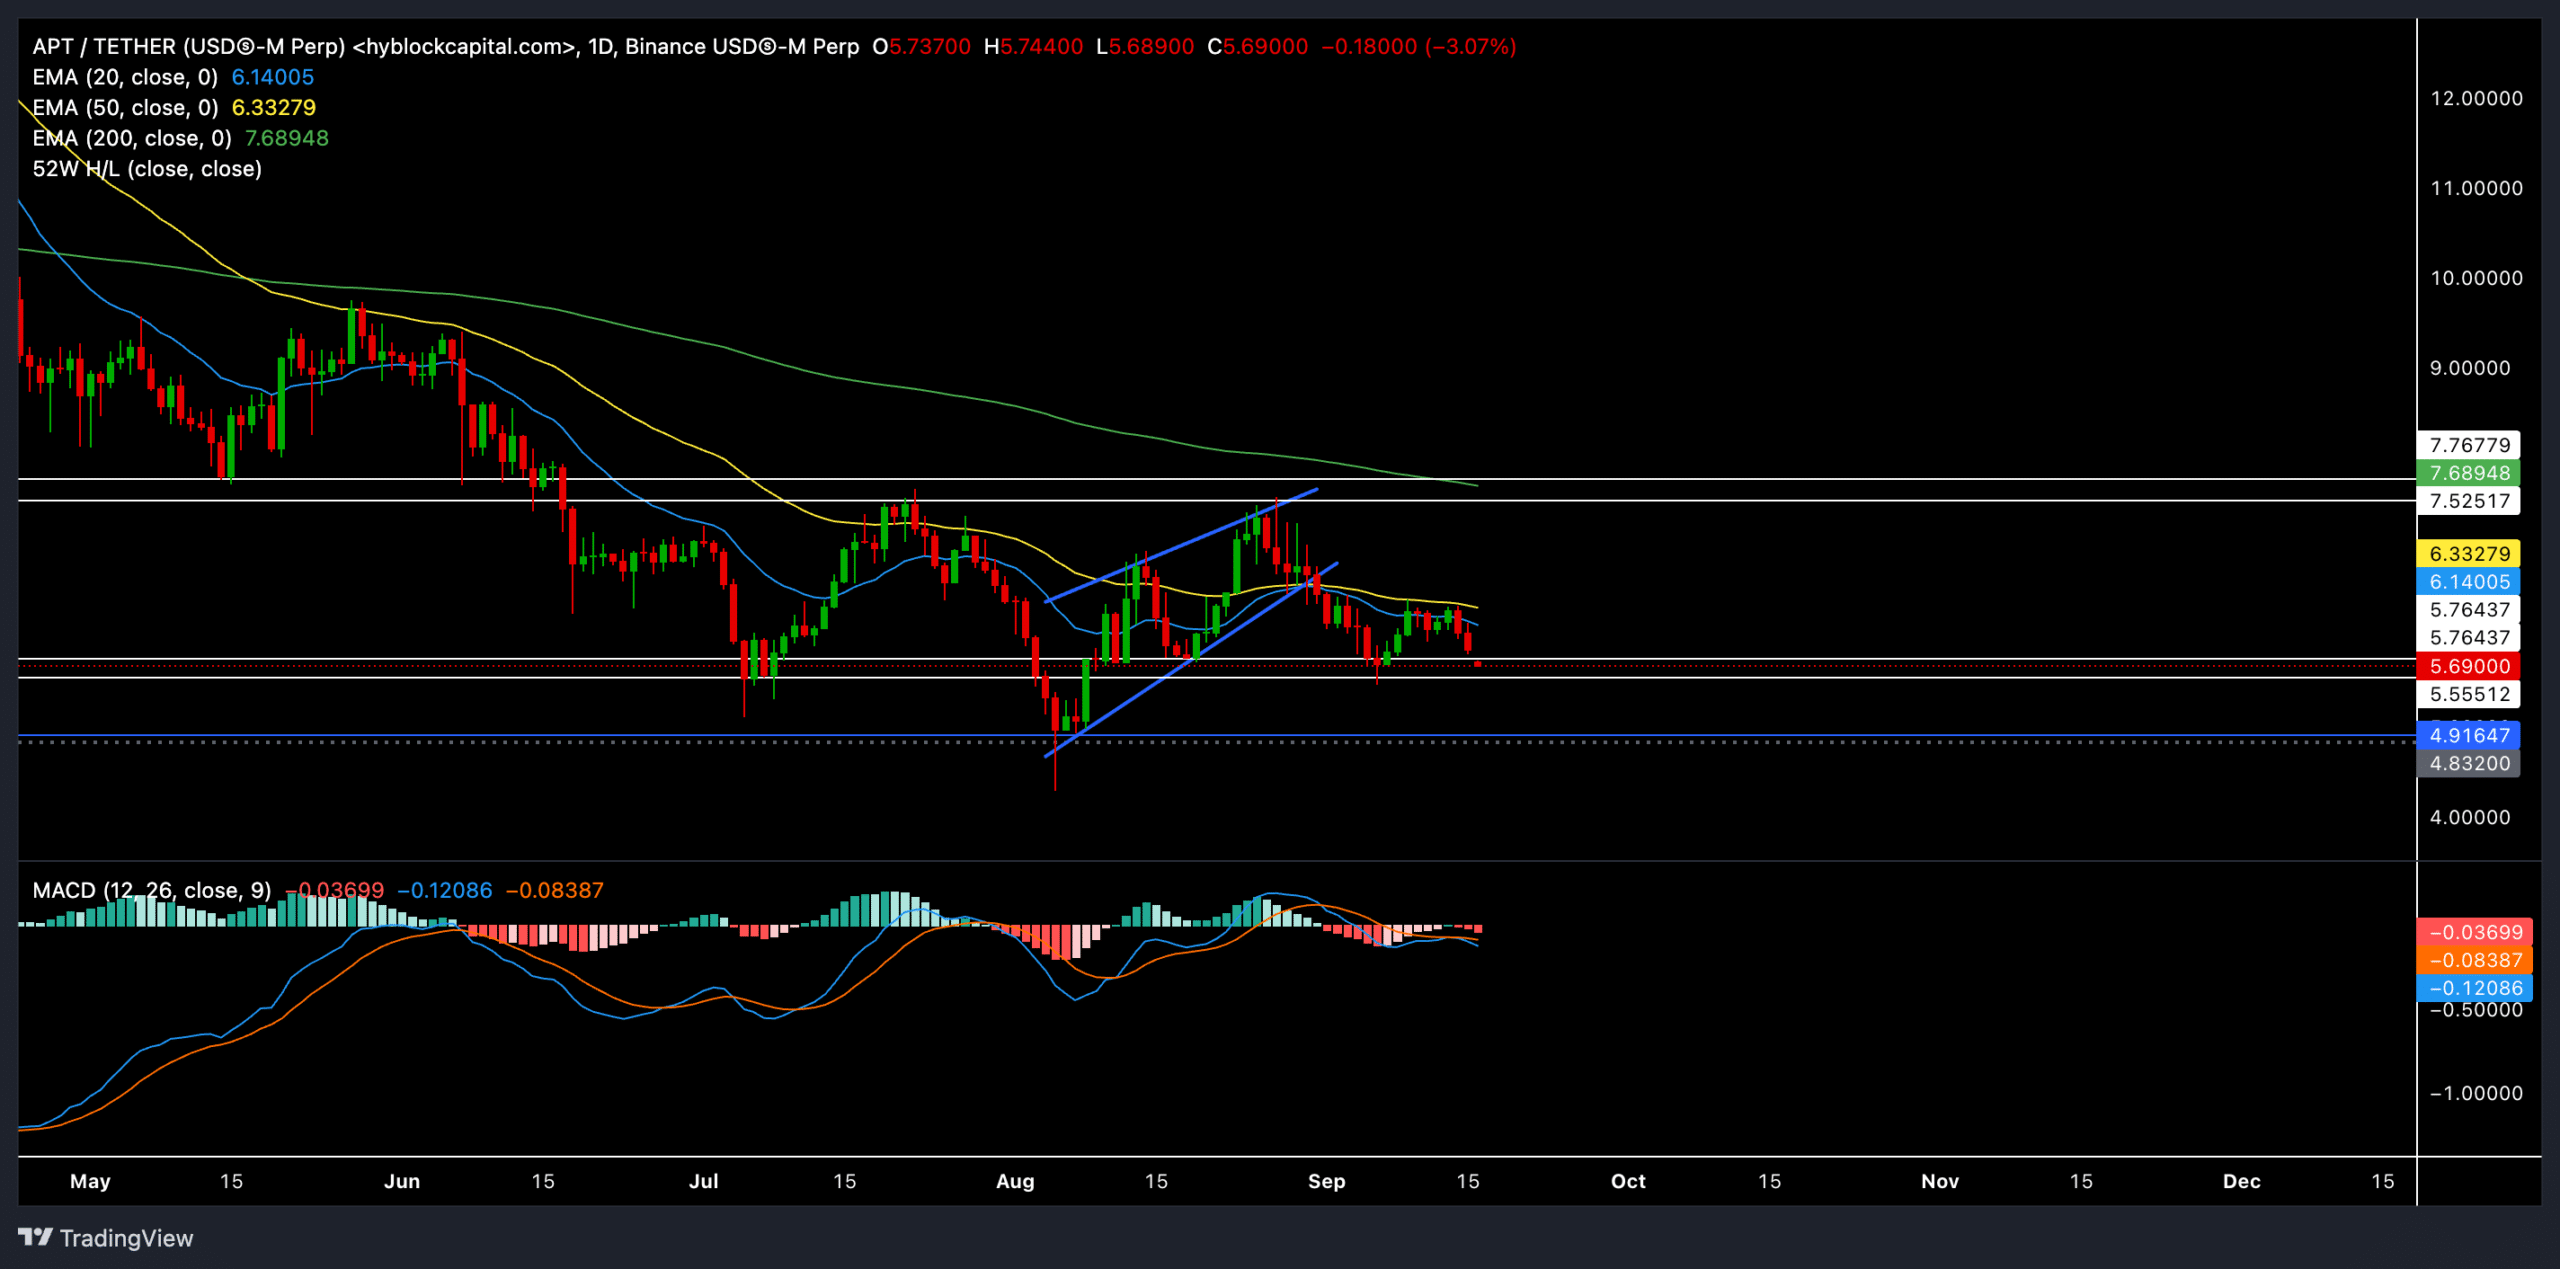
If buyers defend the $5.69 level, we could see a quick retest of the 20 EMA ($6.14) followed by the 50 EMA ($6.33). Should APT close above these resistance levels, the next price targets could lie near $7.25.
However, it’s worth noting that the EMAs are still sloping downward and hinted that bullish attempts might struggle to gain momentum unless there is a stronger influx of buying pressure.
If APT breaks below its $5.69 support, the bears could further drag the price down toward the $4.91-$4.83 range.
MACD showed an increasing gap between the MACD line (blue) and the signal line (orange), both trending in the negative territory. This suggested increasing bearish momentum and affirmed the possibility of a further decline if the $5.5 support doesn’t hold.
Here’s what the derivatives data revealed

The derivatives data reaffirmed the bearish edge, as reflected in the 7.96% drop in open interest to $93.56M. This suggested a lack of new positions entering the market. The long/short ratio also stood at 0.9201, indicating that slightly more short positions are being held than long ones.
On Binance, the long/short ratios for accounts and top traders hovered around 1.6 and 1.4, respectively. This showed a mixed sentiment among traders, with a slight edge to bulls.
While trading volumes surged 67.15% to $182.38M, this may not be enough to spark significant bullish sentiment, especially as the long/short ratio was near equilibrium.
Read Aptos’ [APT] Price Prediction 2024-25
Given the bearish signals from the MACD and the long/short ratio, traders should exercise caution and look for confirmation before making any moves.
Looking for a reversal in momentum near $5.69 or a clean breakdown will be key to capitalizing on trading opportunities in the coming days.


