Bitcoin Rainbow Chart signals ‘BUY’ – But is it the right time?
Bitcoin rainbow chart suggests it's time to buy BTC. Should you jump in?

- Bitcoin Rainbow Chart flashed a buy signal for the asset.
- QCP Capital shared a similar long-term bullish outlook for BTC.
Bitcoin [BTC]’s price has consolidated between $60K and $70K for over six months, with occasional wild drops below $60K.
Although the sideways structure might discourage some players, the Bitcoin Rainbow Chart signaled a firm ‘buy’ opportunity for the asset amid the Fed pivot.
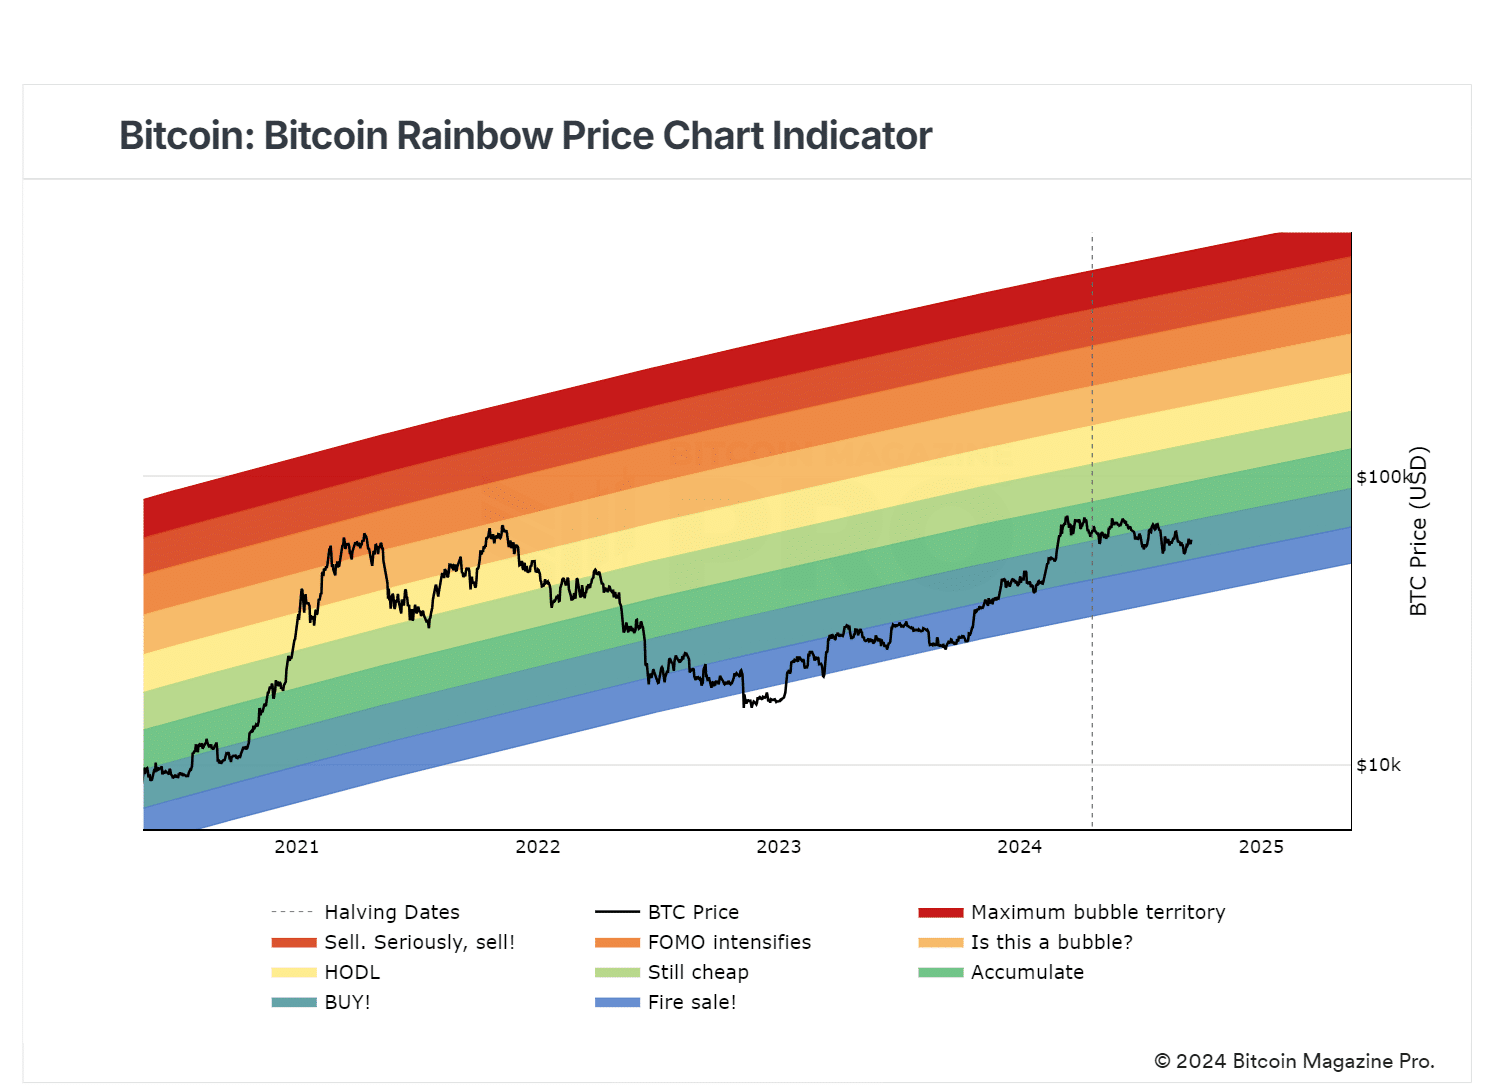
The chart is a valuation model that leverages rainbow colors and past historical patterns to gauge whether the asset is overpriced or underpriced.
The current price action was within the second color band, signaling a great buy opportunity.
More room for BTC to grow?
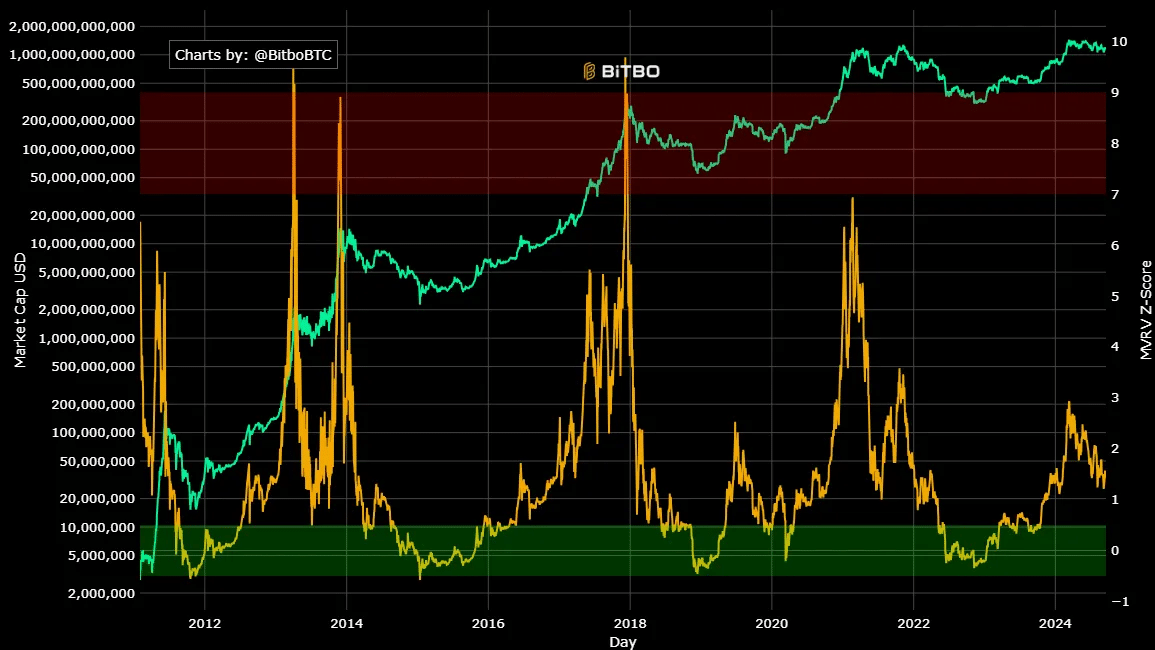
The relatively discounted BTC price was further reinforced by one of the leading market cycle top indicators—the MVRV Z score (Market Value to Realized Value). In past cycles, BTC topped out when the metric hit 7 to 10.
In short, the current reading near 1 suggested more room for BTC prices to rally. If so, current BTC prices can be deemed a massive bargain.
Speculators’ positioning further mirrored this bullish outlook, especially in the Futures market. According to Edwards Charles, founder of crypto VC firm Capriole Investments, the markets were in a BTC perpetual bullish regime.
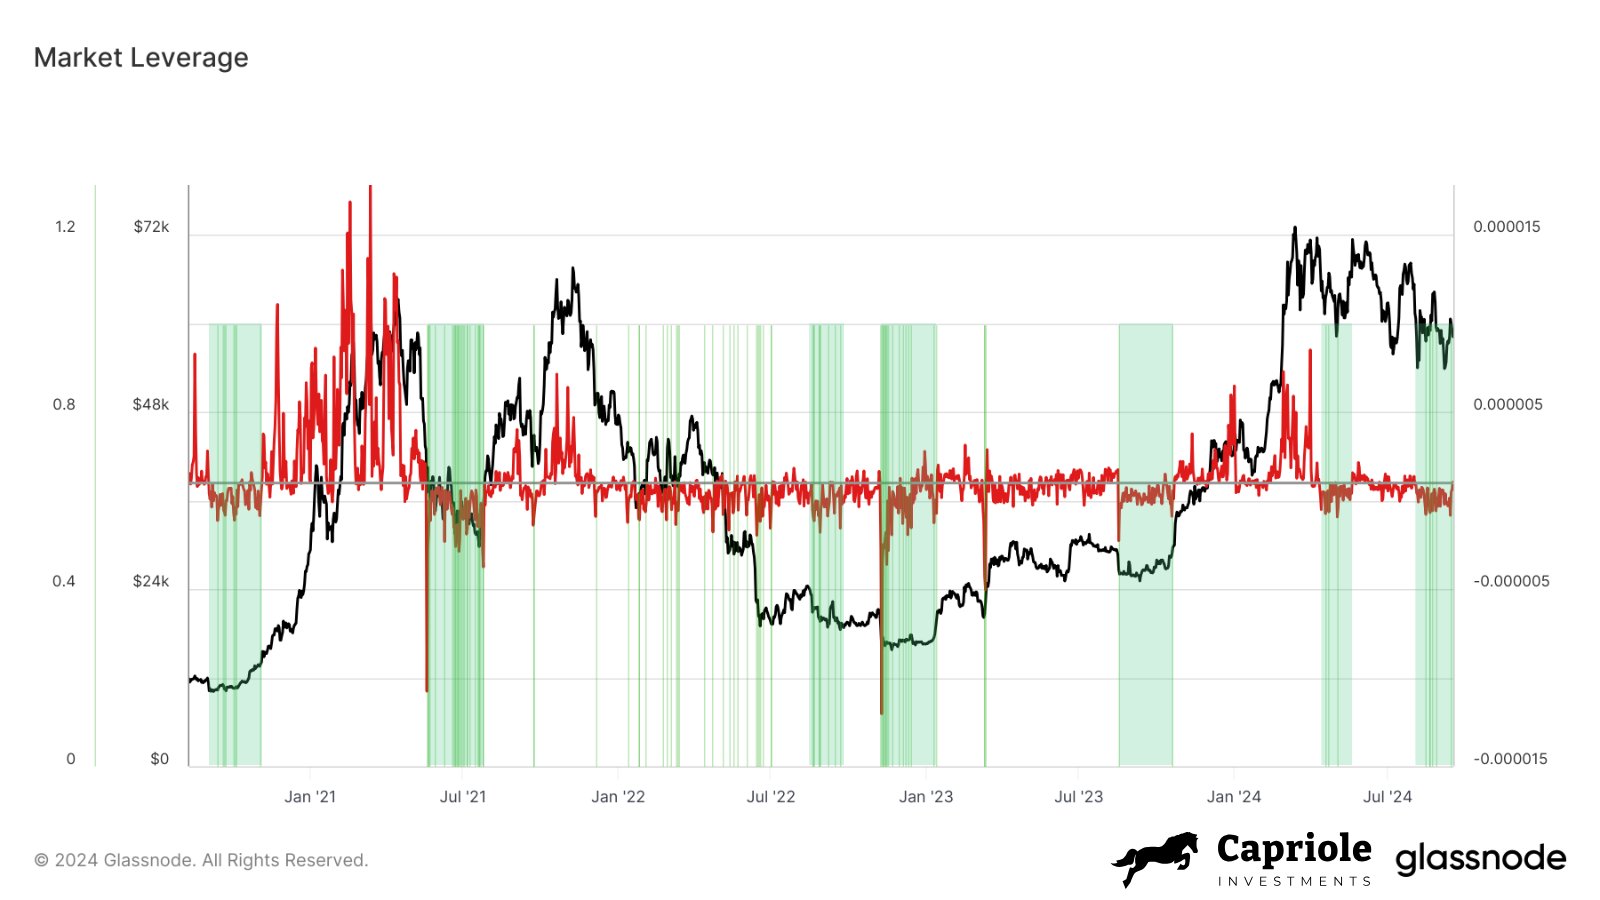
For context, bullish perpetual (marked green) denoted rising market leverage and opened perpetual contracts.
It meant more speculators were taking extra risks to open perpetual contracts using leverage. It suggests future price rally expectations and has historically marked BTC bottoms.
However, using market leverage carries massive liquidation risk that could drive volatile downside risk.
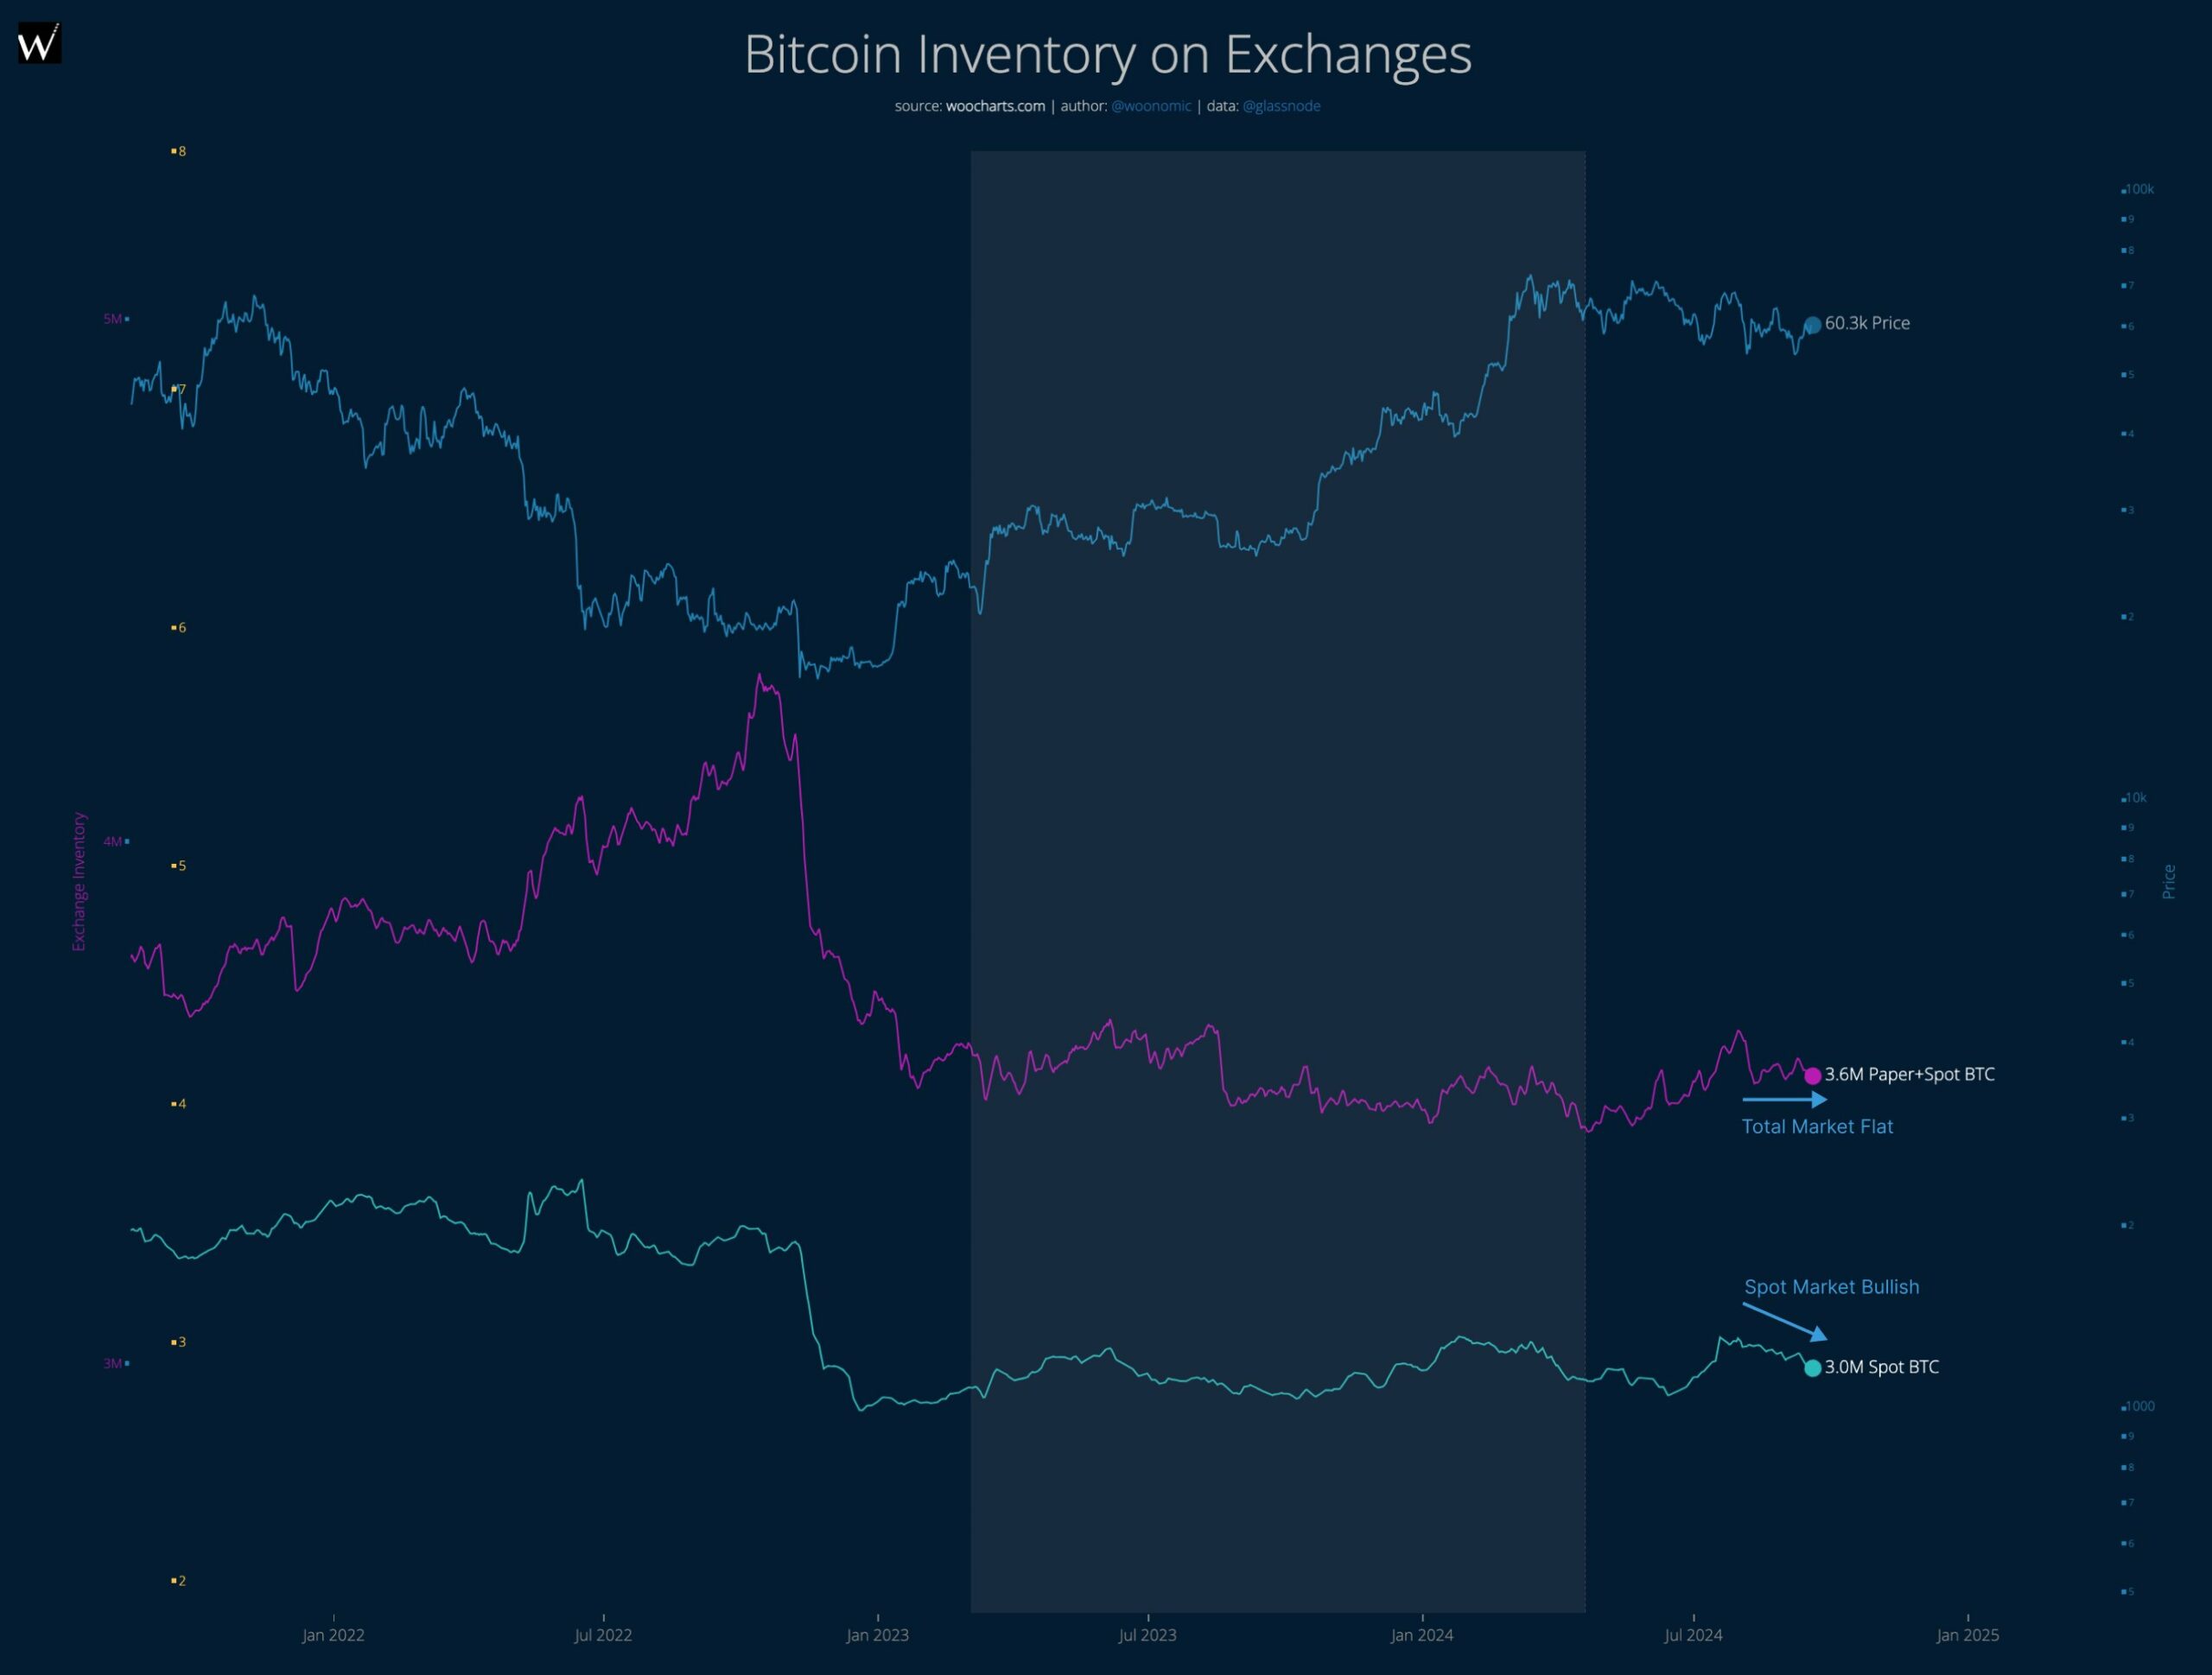
That said, Bitcoin analyst Willy Woo claimed he was “cautiously optimistic” because the asset hasn’t decisively flipped to bullish. He said,
“Current demand and supply is neutral bearish, but signs of moving into a bullish structure if we get some liquidations. Cautiously optimistic”
However, crypto trading firm QCP Capital maintained a long-term bullish outlook for BTC amid Fed pivot. It stated,
“The start of a rate-cutting cycle aimed at normalizing interest rates supports hard assets as stores of value. While drawdowns and high volatility are expected, don’t let that distract you from the path to higher BTC prices.”