Examining SAND’s price action: Ready for an 80% hike?
SAND is primed for a breakout, with key metrics signaling a potential long-term rally.

- SAND’s breakout from a falling wedge pattern signals an 80% price surge if it clears the 100-day moving average.
- Bullish momentum is supported by rising active addresses, lower exchange reserves, and short liquidations.
The Sandbox [SAND] has confirmed a breakout from its falling wedge pattern, raising anticipation of a significant upward price movement. With key targets set at $0.31 and $0.40, analysts are closely watching the 100-day moving average.
A break above this critical level could trigger an 80% price surge. Will SAND sustain this momentum and ignite a long-term rally?
How are transactions and active addresses shaping up?
One of the key indicators of market activity is the number of unique active addresses. At the time of press, SAND has 26.96 active addresses, reflecting a 1.2% increase in the past 24 hours.
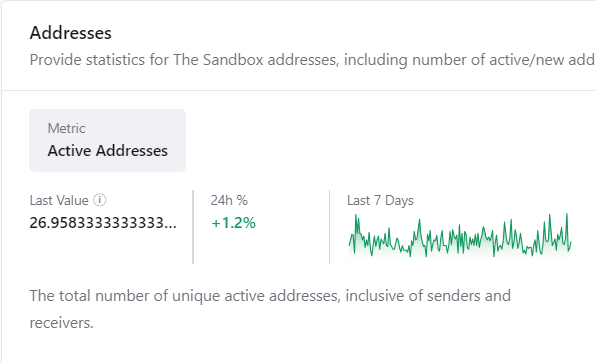
Additionally, transaction volume supports this positive momentum, showing a 1.37% rise to 529 transactions, as per CryptoQuant data.
This steady increase in activity signifies that more users interact with the network, potentially building the foundation for the anticipated price surge.
Exchange reserve analysis: What does it mean?
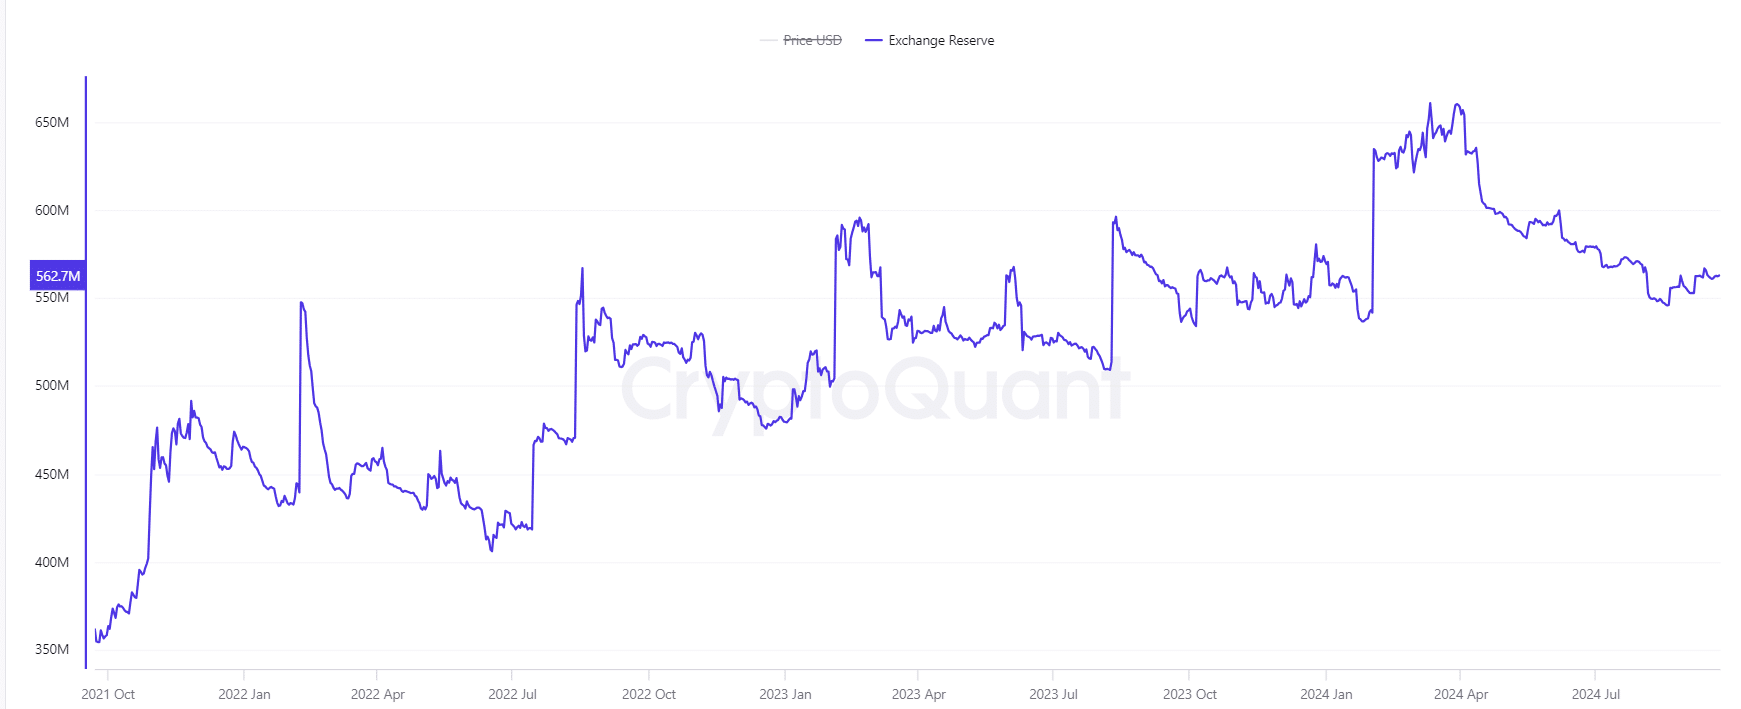
The exchange reserve for SAND currently holds 562.76 million tokens. A slight 0.02% decrease indicates a reduction in selling pressure.
Generally, a falling exchange reserve implies that fewer tokens are available for sale, suggesting that investors are holding onto their assets in anticipation of a price rise.
Consequently, this aligns with the bullish breakout pattern observed on the daily chart, reinforcing the likelihood of an upcoming rally.
SAND liquidations: Can the bulls take over?
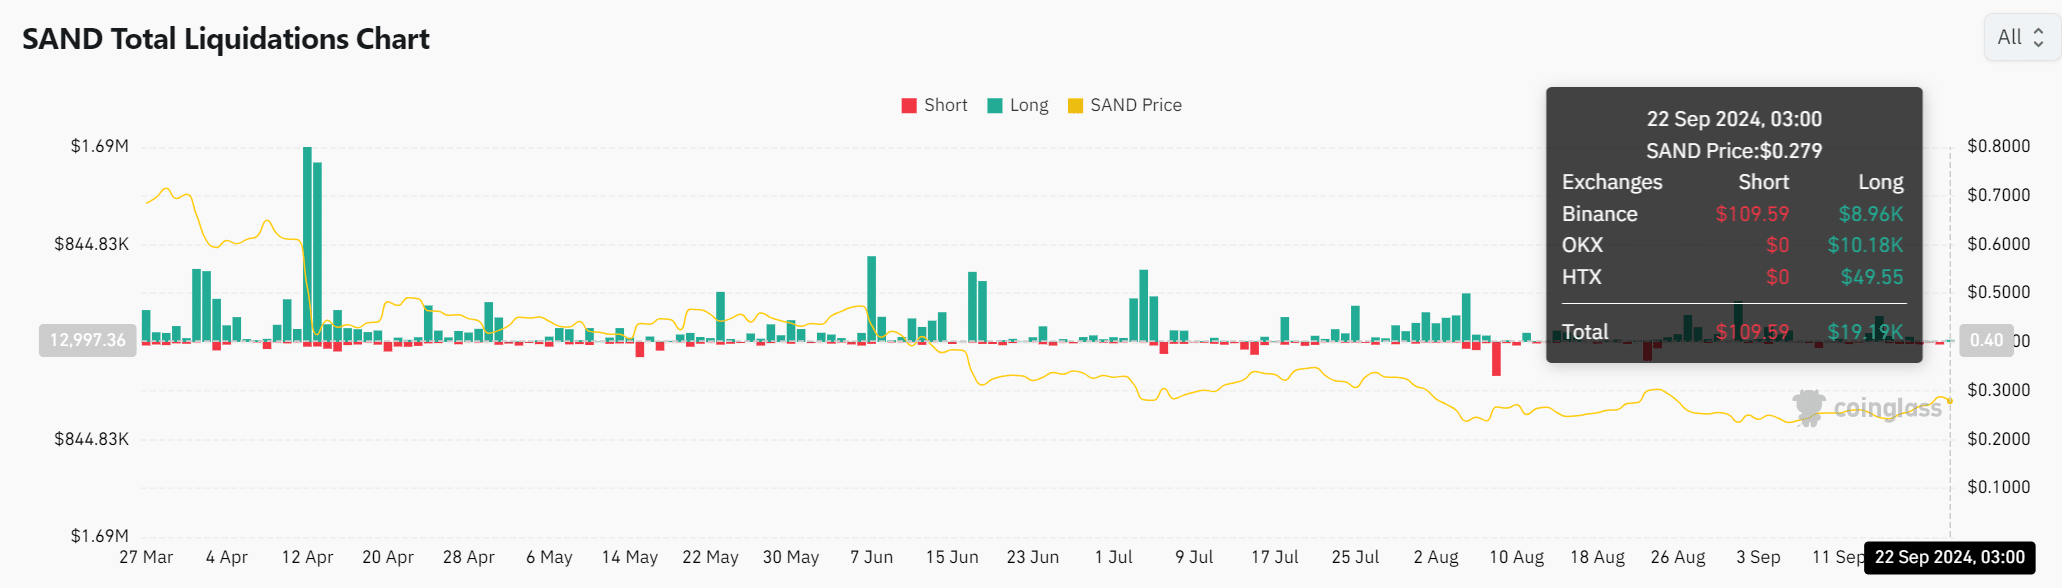
Liquidation data provides a clear snapshot of market pressure. The recent figures reveal that $109.59K of short positions were liquidated, compared to just $19.19K in long positions.
This imbalance indicates that traders betting against SAND are facing losses as the asset strengthens.
With the price hovering around $0.279 at press time, this trend in liquidations might clear the path for further bullish momentum, potentially pushing SAND to test the $0.31 target and beyond.
Realistic or not, here’s SAND market cap in BTC’s terms
Will SAND hold its breakout?
With transaction volumes rising, active addresses increasing, and exchange reserves decreasing, SAND’s market structure seems well-prepared for a sustained upward move. The liquidation data further bolsters a bullish scenario, as short positions continue to be squeezed out.
Breaking the 100-day moving average could solidly place SAND on the path to significant gains, aiming for short-term targets of $0.31 and $0.40.