The Graph gains 28% in a week: Will bull’s dominance continue?
The Graph token saw high demand in recent days and little selling pressure. The Funding Rate was also positive.
- GRT has a bearish market structure on the daily, despite strong short-term gains.
- The moving averages signaled that the long-term downtrend was still in play.
The Graph [GRT] token has performed well since last Monday. Like the rest of the crypto market, the token has registered double-digit price gains. It remains to be seen whether the bulls can defend these recent gains.
While the short-term bias was bullish, the long-term trend has been bearish. The performance since June has been in favor of the sellers, and the bulls might not have the strength yet to force a sizeable recovery.
The Graph is on the verge of breaking August highs
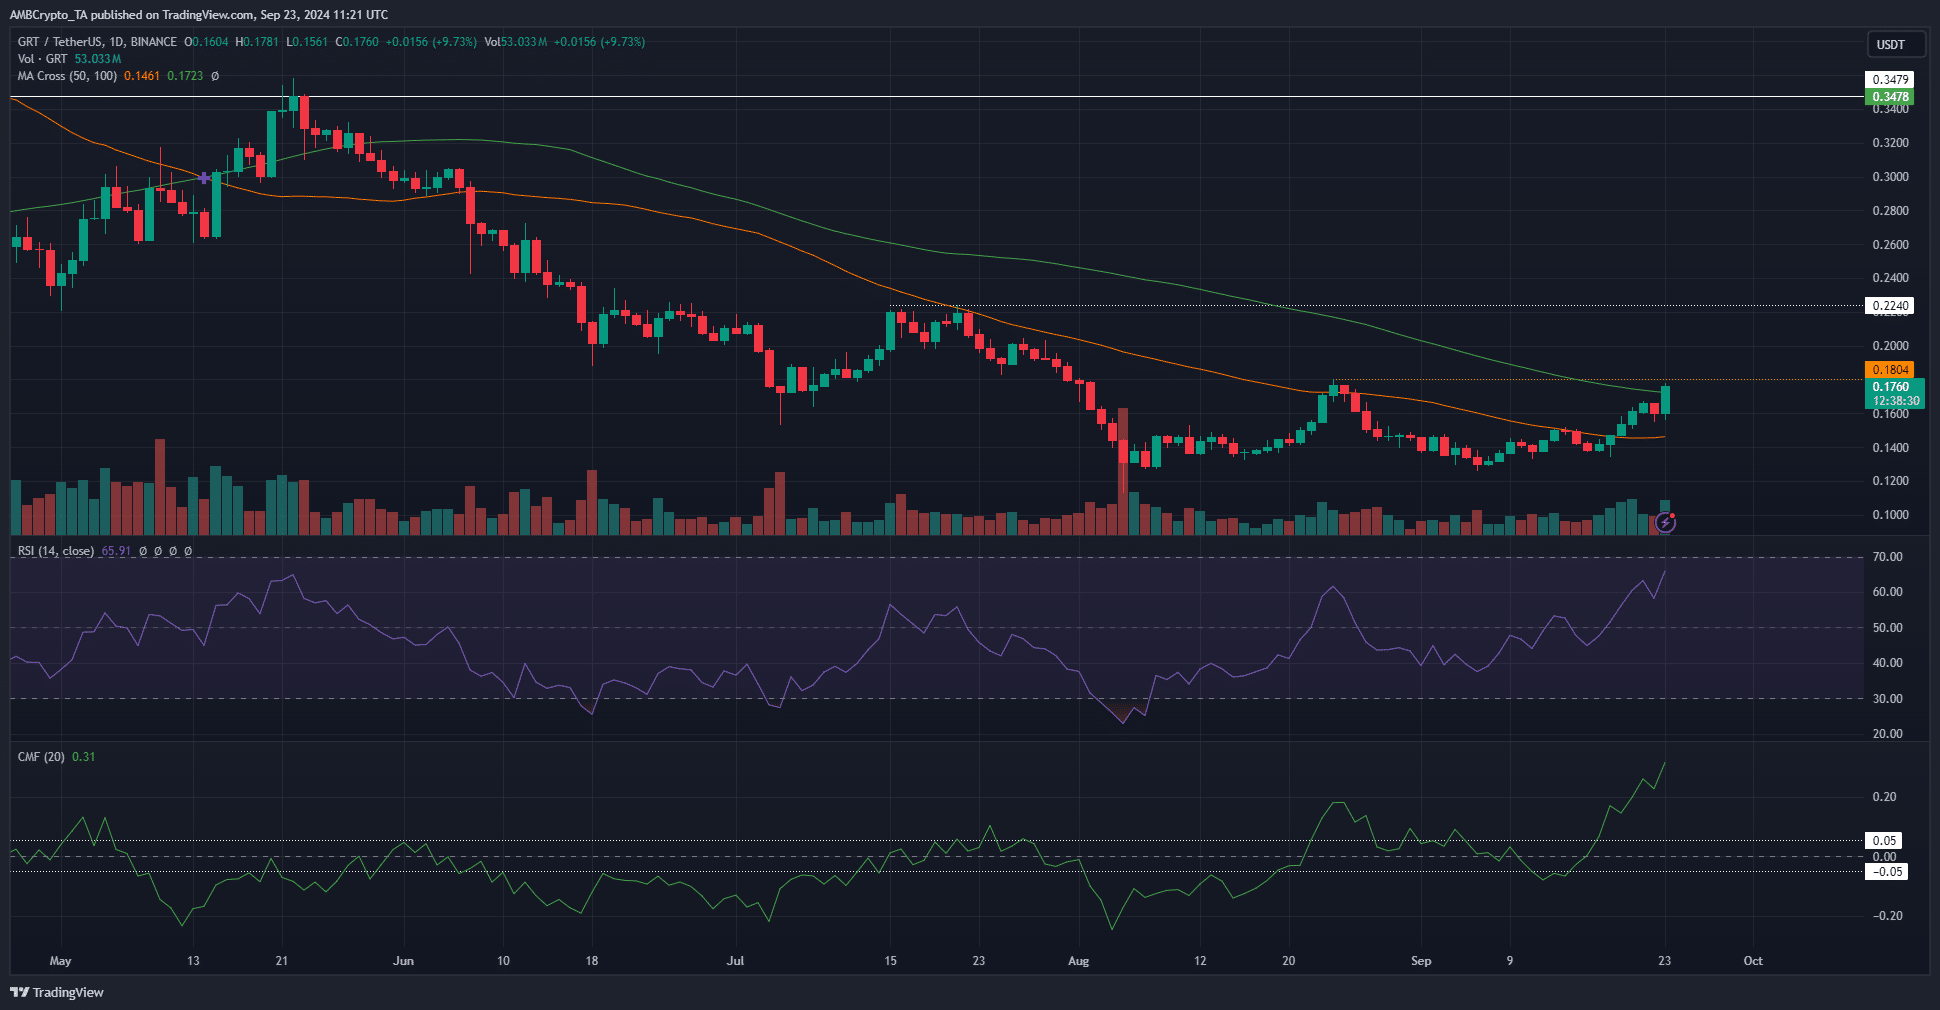
The Graph token was performing well over the past week and was charging toward the local resistance level at $0.18. The RSI was at 65 and has been rising since the second week of September.
This showed bullish momentum has been building up. The CMF also recovered from -0.05 to reach +0.31, a reading not seen on the indicator since February.
This indicated heavy capital flow into the GRT market, which could bolster bullish efforts to break the $0.18 resistance.
The simple moving averages captured the essence of the downtrend. The faster 50DMA was still below the 100 DMA, meaning that the recent move higher needs to be sustained for a longer period to break the downtrend.
Lack of selling during the minor price dip was encouraging
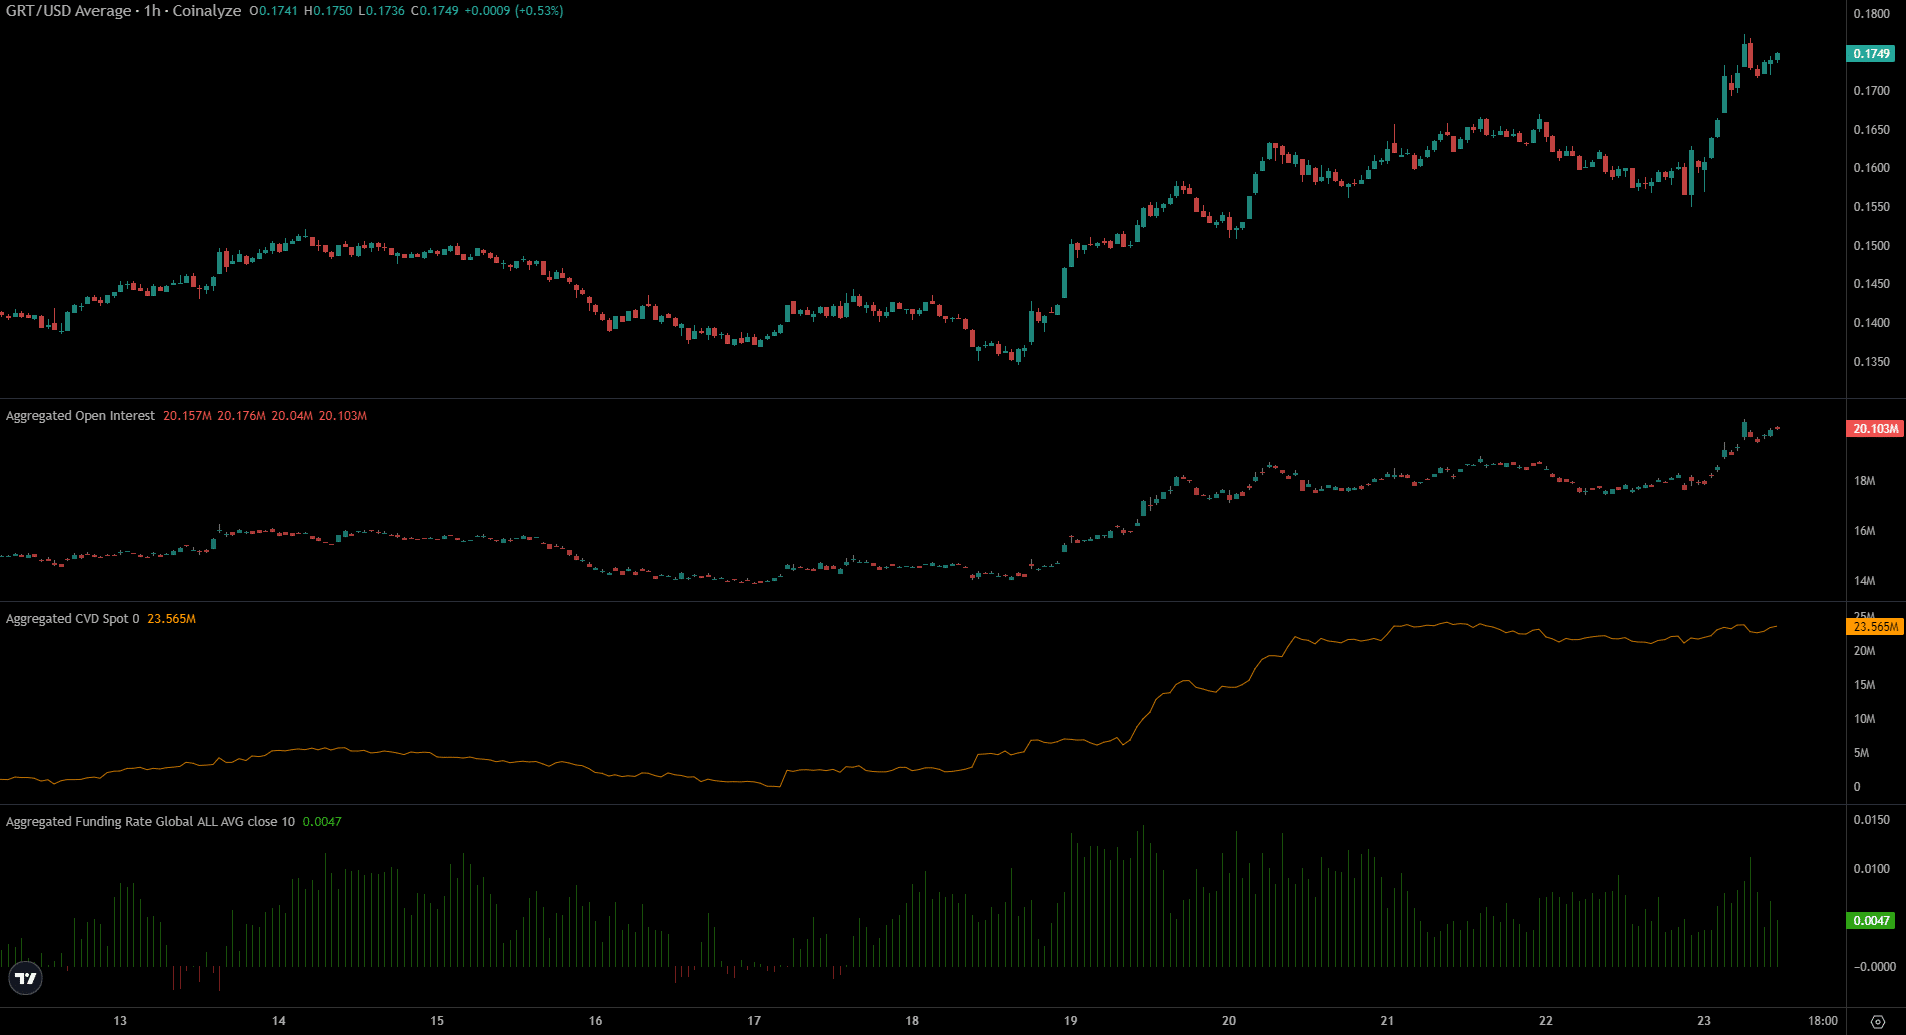
Over the past week, both the price and the Open Interest have surged higher to show bullish sentiment. Speculators are eager to go long on GRT. This was a market-wide phenomenon after the Bitcoin resurgence.
Is your portfolio green? Check out The Graph Profit Calculator
Other assets have seen their spot CVD remain in a sideways trend, meaning the rally was not supported by spot demand.
The Graph token saw high demand in recent days and little selling pressure. The funding rate was also positive.
Disclaimer: The information presented does not constitute financial, investment, trading, or other types of advice and is solely the writer’s opinion