Bitcoin and U.S stocks in sync again – What does this mean for you?
Bitcoin has broken a key resistance level and is increasingly moving in sync with U.S. stocks.

- BTC and the S&P 500 have been seeing a high correlation lately
- Cryptocurrency has continued to trade above $65,000 on the price charts
Bitcoin [BTC] recently broke through a significant resistance level, continuing its positive uptrend on the charts. Interestingly, the cryptocurrency’s correlation with U.S stocks has climbed to a two-year high too. This means that Bitcoin is increasingly moving in tandem with traditional financial markets.
Bitcoin’s correlation with U.S stocks hits two-year high
Recent data from IntoTheBlock revealed that Bitcoin’s correlation with U.S stocks has hit a two-year peak. Over the past three months, Bitcoin has seen moderate volatility with periods of slight increases and decreases, maintaining a range close to its starting value.
Overall, BTC’s price movement has been relatively stable, with a subtle positive trend towards the end of September.
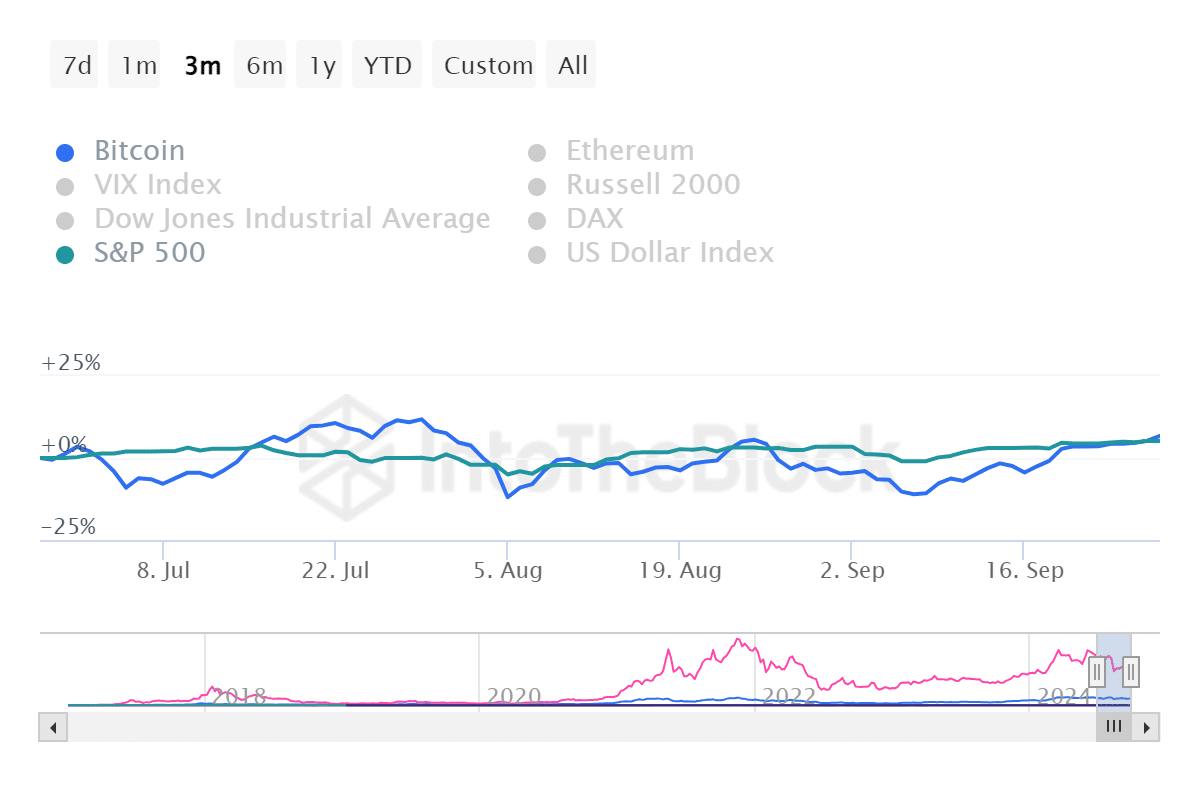
On the contrary, the S&P 500 has exhibited steady performances with less pronounced volatility, compared to Bitcoin. Both assets have moved relatively in sync though, reflecting similar market sentiments.
While BTC’s inherent volatility results in slightly more pronounced movements, the parallel trends indicate that it is currently behaving like a risk asset. One closely following macroeconomic trends and investor sentiment.
Implications for Bitcoin investors
Bitcoin’s price trend suggests a “risk-on” environment, one where investors maintain or slightly hike their exposure to traditional equities and cryptocurrencies. BTC could benefit from the positive sentiment if the S&P 500 continues its steady performance or improves. However, any negative shocks in the equity market might also affect BTC due to their correlated movements during this period.
As the correlation persists, Bitcoin’s price movements may increasingly mirror those of traditional equities. In times of rising stock markets, this can be bullish for BTC, as a risk-on sentiment drives more inflows into BTC and other crypto assets.
Bitcoin continues its upward momentum
An analysis of Bitcoin’s daily chart revealed that it closed with gains of less than 1% in the last trading session.
However, the price briefly touched the $66,000-level before settling around $65,789. At the time of writing, BTC was trading at approximately $65,660, following a slight decline of less than 1% on the charts.
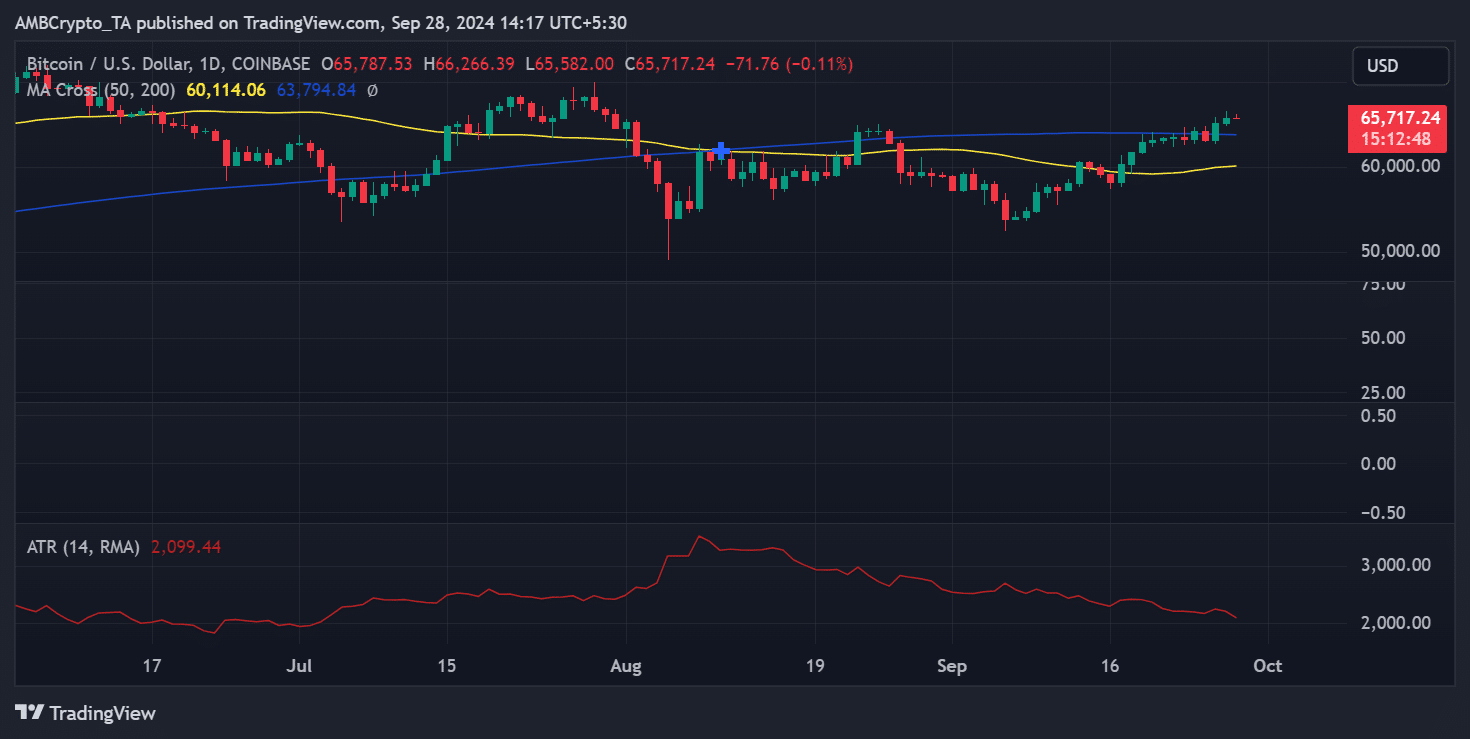
Furthermore, an analysis of its Average True Range (ATR) highlighted a value of around 2,099.44. This meant that on average, Bitcoin’s price range (from high to low) over the last 14 periods is approximately $2,099. The ATR has been declining since mid-August, indicating that volatility has decreased over time.
This could mean that the market has been seeing less intense price movements, compared to previous months.
– Read Bitcoin (BTC) Price Prediction 2024-25
When the ATR is low, it may indicate that the asset is gearing up for a breakout in either direction.


