Ethereum price prediction shows bulls might struggle from THIS point
The netflows chart did not support a strongly bullish Ethereum price prediction.

- ETH’s performance against Bitcoin was less than ideal, leading to a weekly bearish structure.
- Until the $2.8k and $3k levels are breached, the outlook will remain bearish.
Ethereum [ETH] witnessed a continued increase in gas fees as the network activity marched higher. This is attributed partly to the rising use of decentralized finance (DeFi) platforms on the network and increasing ETH transfer volumes.
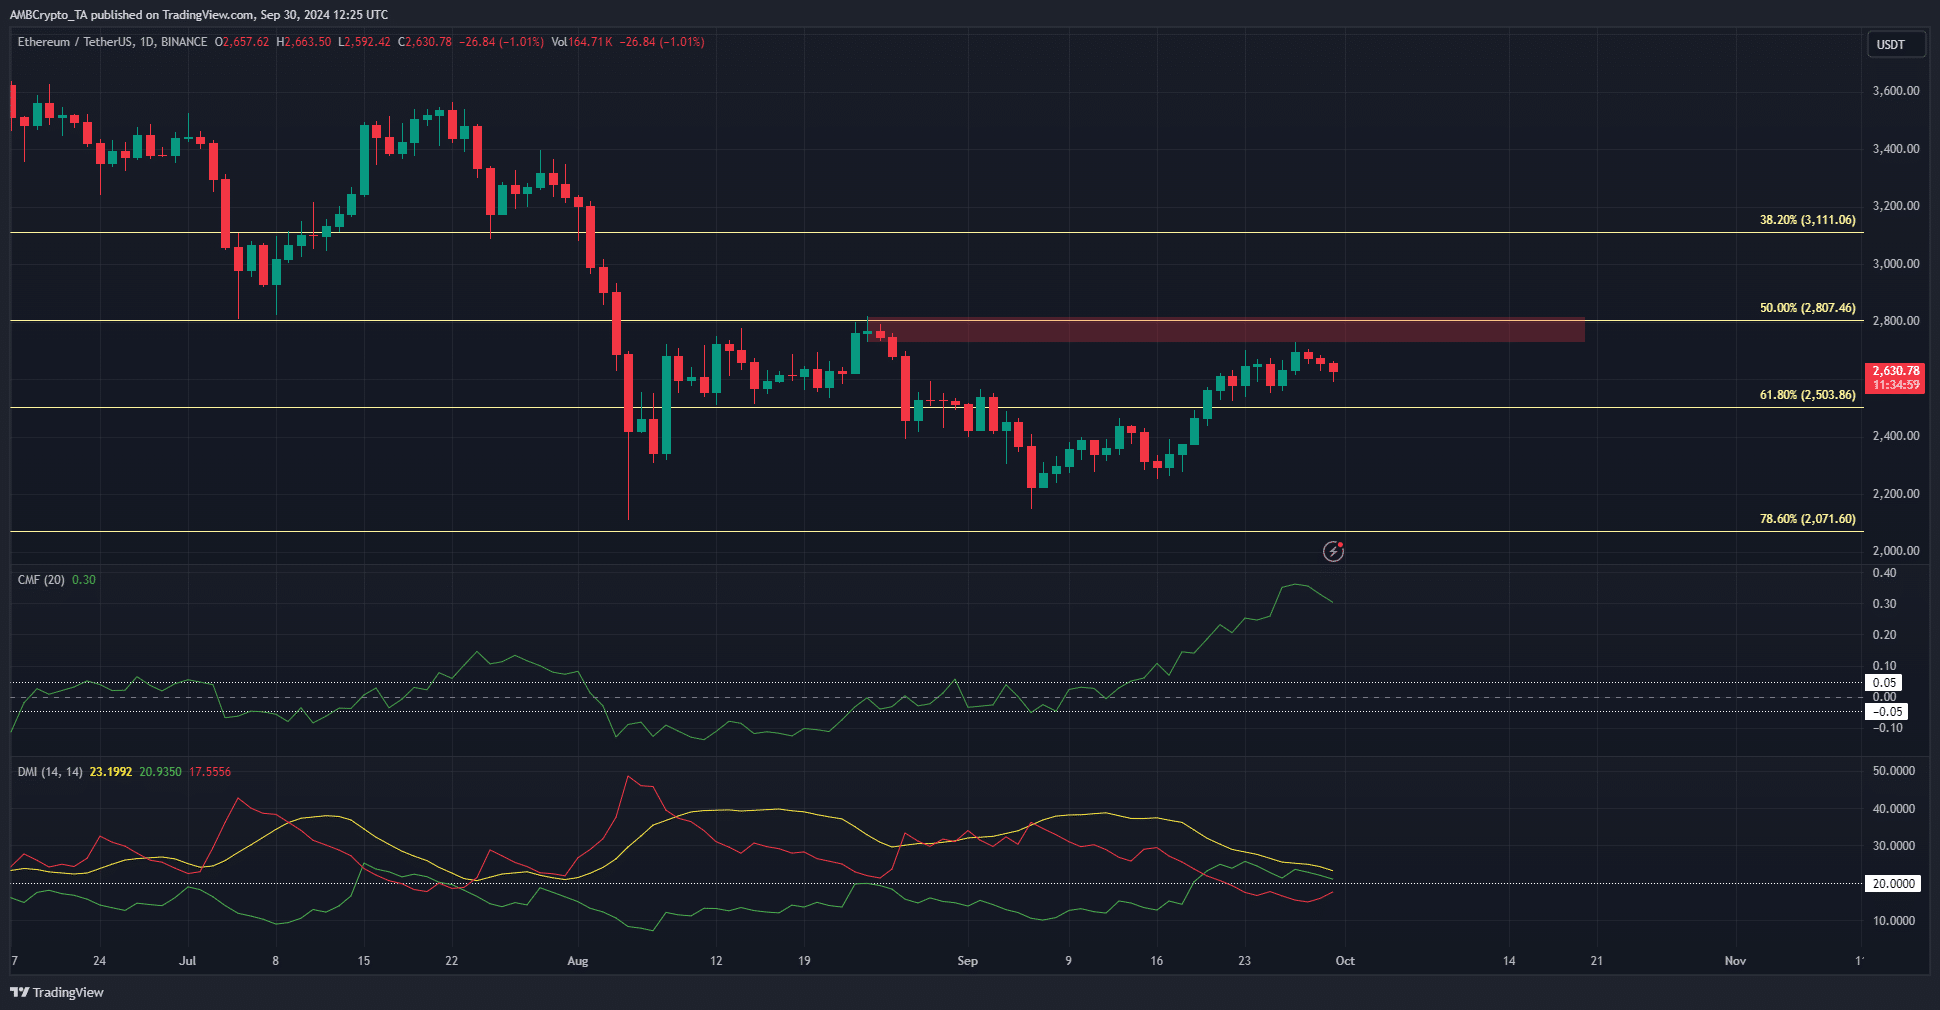
Technical analysis showed that although the market structure and momentum were bullish on the daily, key resistance levels overhead need to be breached.
Ethereum has lost much ground during the consolidation
Since the highs of March, Bitcoin [BTC] was only down by 13.4% at press time. By comparison, ETH was down by 35.8%. This bleak performance against the king of crypto meant that the Ethereum price prediction favored a bearish outlook until the $3k resistance is broken.
The weekly chart is in a downtrend, and the most recent lower high to beat is at $2,820. Beyond these two levels, the $3.6k area would be the next significant challenge.
The CMF was at +0.3, reaching a high on the daily chart not seen since March. This relatively high buying pressure has spurred the asset’s 16.7% gains in the past two weeks.
The ADX (yellow) and the +DI (green) on the DMI were above 20 to signal a strong trend and a bullish trend respectively. Despite this, the 50% Fibonacci retracement level continued to stall the bulls.
Netflows give clues on trend strength
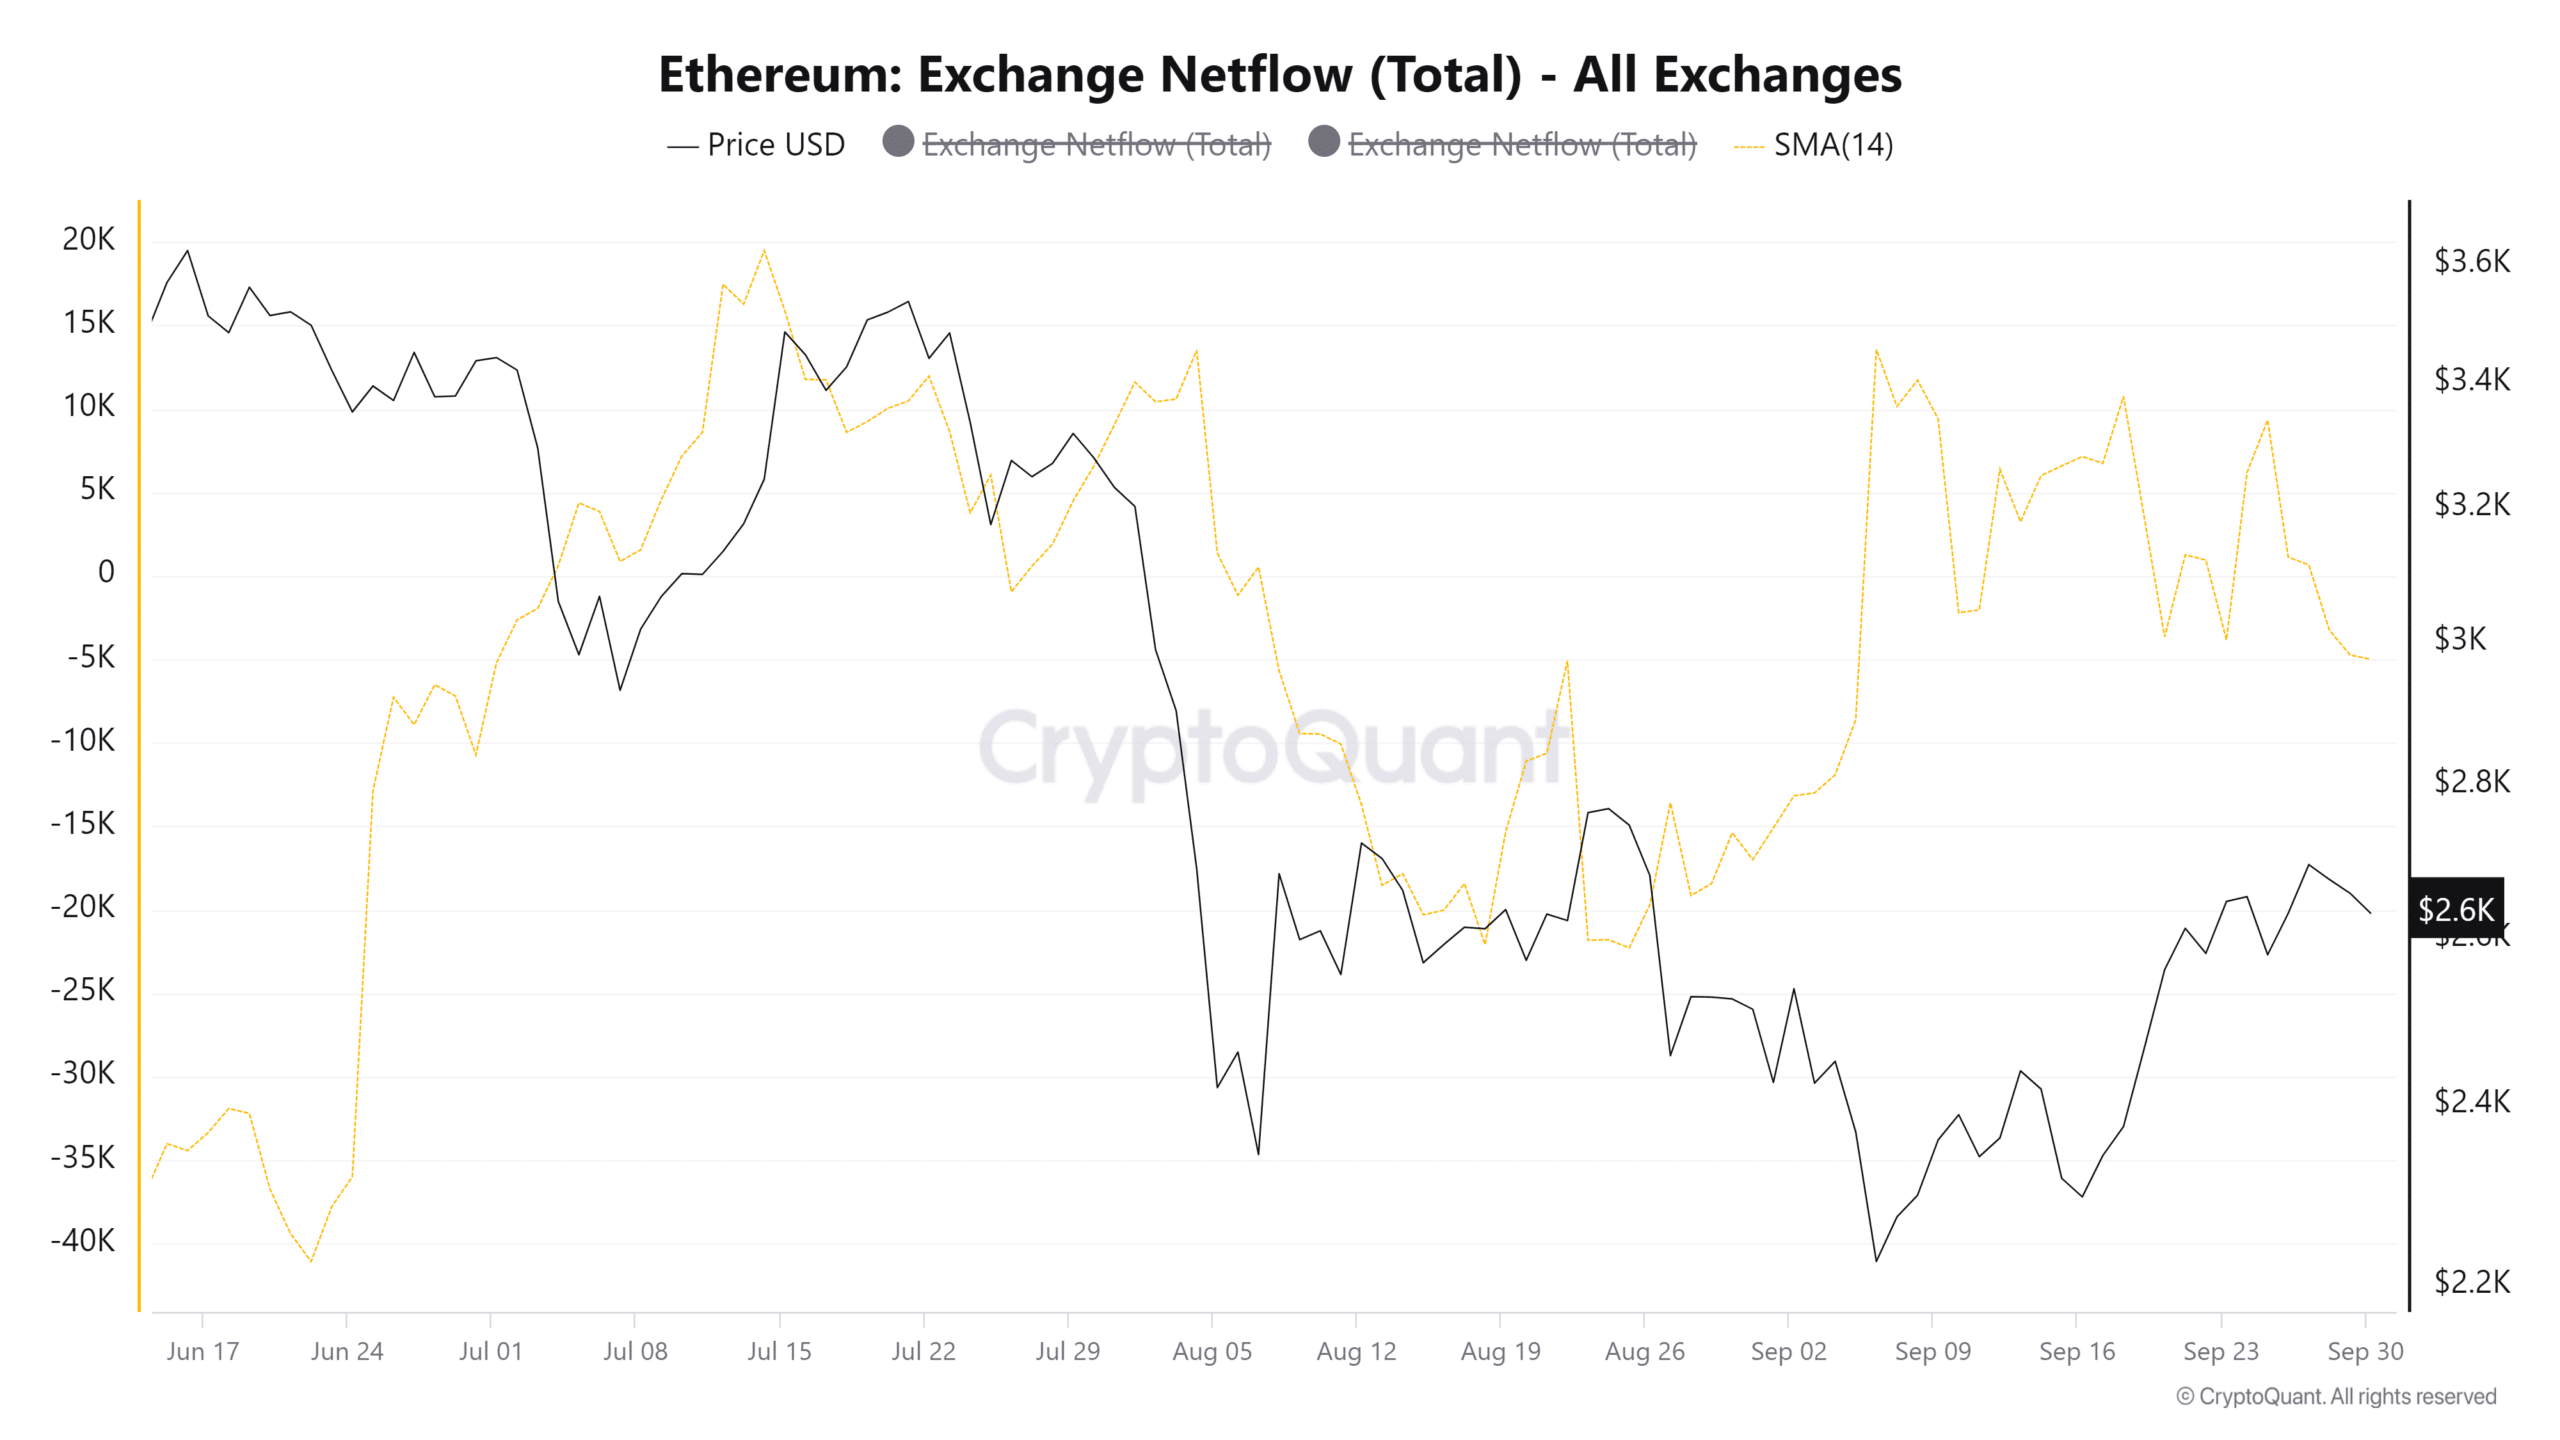
Since late July, the flow of Ethereum from centralized exchanges has been primarily directed outward. This supported the idea of accumulation. However, it was not as heavy as it was during February or November 2023.
Is your portfolio green? Check the Ethereum Profit Calculator
Additionally, in the past two weeks the netflows saw many positive days. The volume was not high enough to be termed an exodus, but it also showed that some holders were happy to take profits. This could be due to the performance of ETH since March.
As thing stand, the netflows chart did not support a strongly bullish Ethereum price prediction for the next 4-8 weeks.
Disclaimer: The information presented does not constitute financial, investment, trading, or other types of advice and is solely the writer’s opinion