Sui bulls need to break the $1.81 resistance soon, or else…
SUI has a robustly bullish structure on the daily chart, but the $1.81 resistance is pivotal.

- Sui has a bullish daily market structure and notable buying pressure.
- The Fib levels and the bearish divergence contributed to the rejection.
Sui [SUI] was on a strong bullish run, but the recent market-wide volatility marred it. Since the 1st of September, the token has gained 131%. It maintained a firmly bullish bias on the daily chart.
The trading volume was above average and the structure suggested that a continued rally higher was likely. There was one obstacle in the way of bullish targets at $2 and above.
Steady buying volume and firm accumulation trends
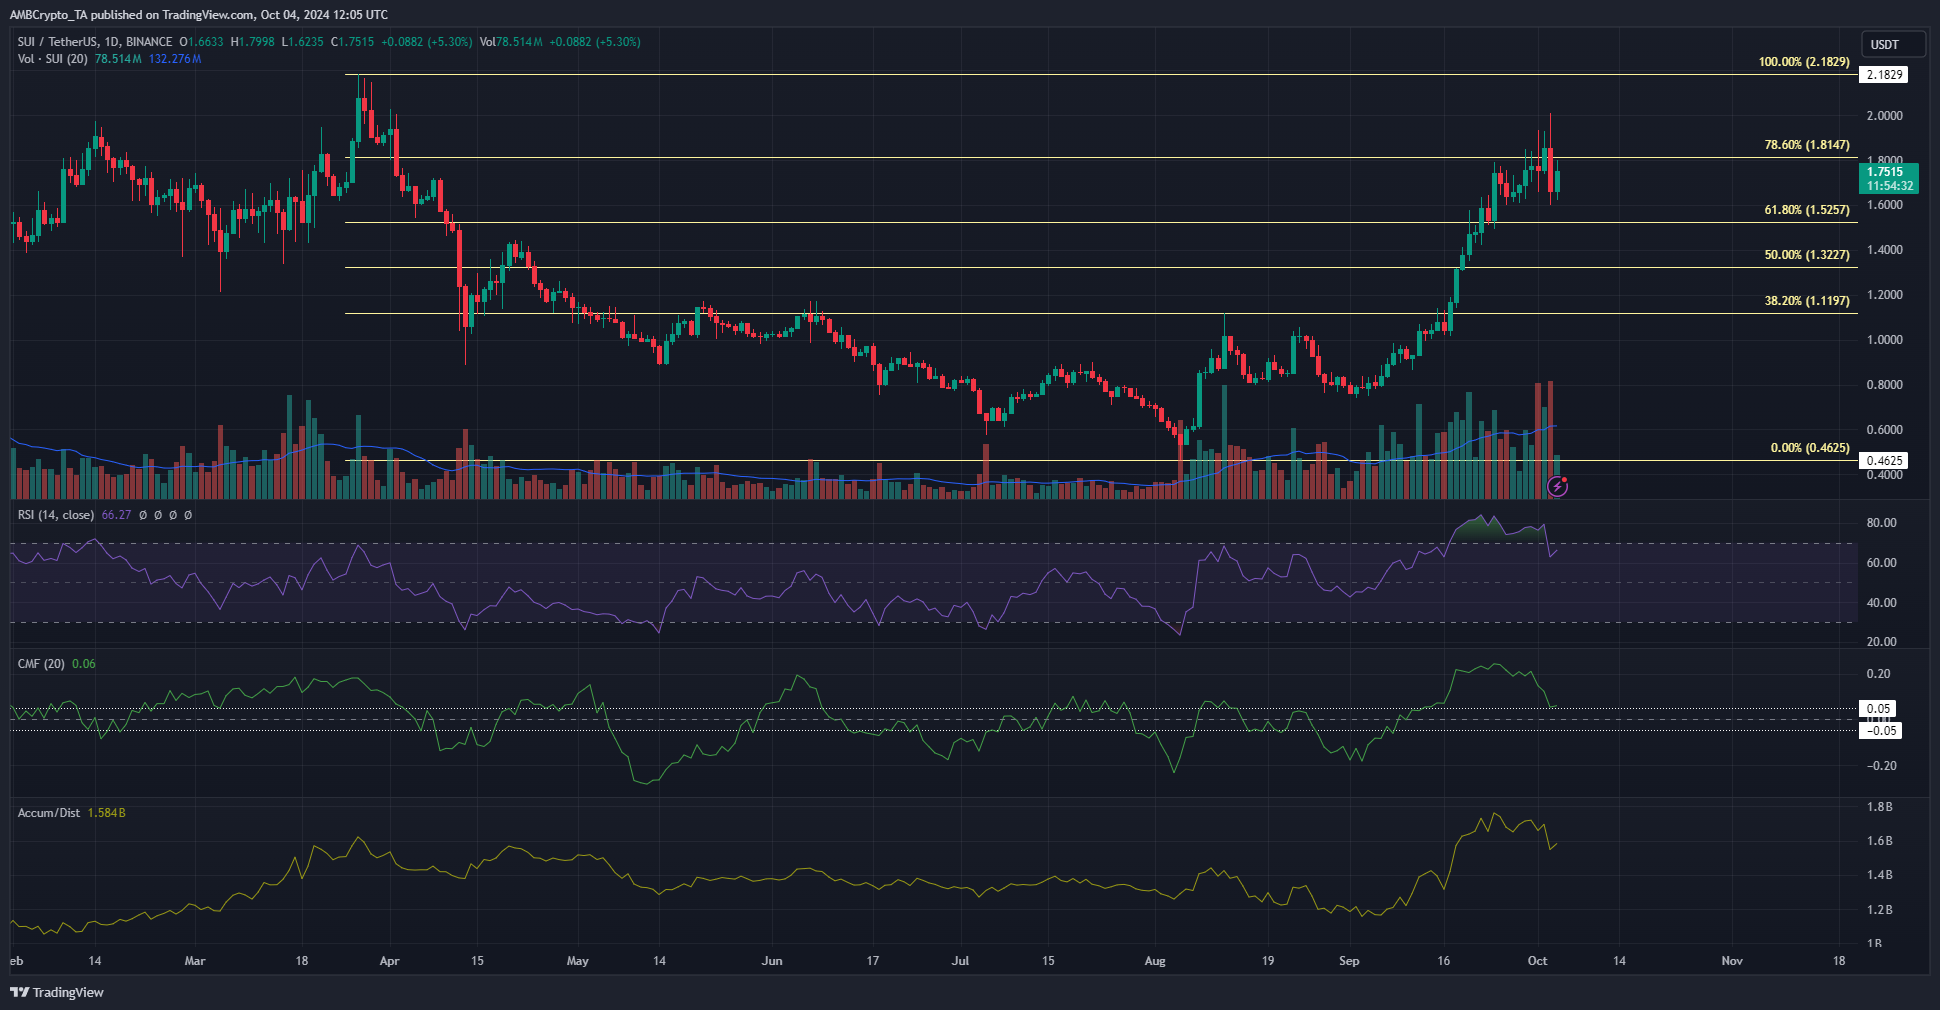
The daily market structure has been bullish since 15th September. This came after a brief price dip to $0.8 was followed by a strong recovery. The trading volume in September was high compared to July and the latter half of August. This highlights bullish belief.
The buyers were able to carry on with this belief and drive prices higher. They reached the $2 level but were stymied by selling pressure that evolved after Bitcoin [BTC] saw a correction from $66.5k.
The CMF was at +0.06 while the A/D indicator broke above the March and April highs. Together, they showed that recent buying pressure was hefty and that the accumulation trends in September were favorable to the bulls.
The Fibonacci retracement levels stall SUI bulls
The daily RSI had formed a bearish divergence on the 2nd October. This occurred as the token price reached the $1.81 resistance level, the 78.6% retracement level based on the downtrend Sui saw from April.
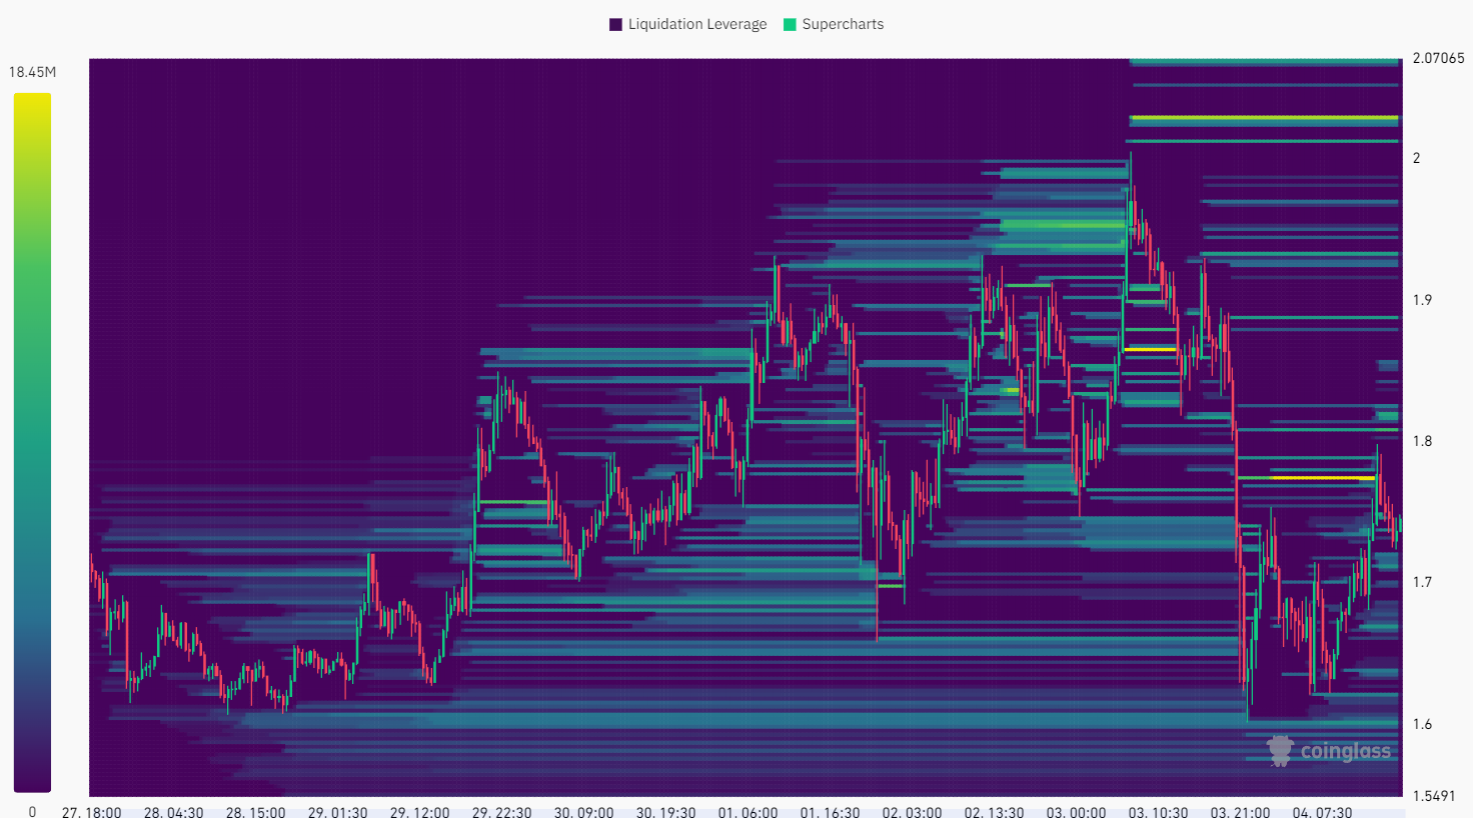
The short-term liquidation heatmap data outlined the $1.77 zone as a region with high liquidity. The recent move upward swept this liquidity, reached the psychological $2 resistance, and is below the Fib level once more.
Is your portfolio green? Check the Sui Profit Calculator
The token has a robustly bullish structure on the daily chart, but the $1.81 resistance is pivotal. If the bears continue to defend this level, it could evaporate bullish conviction and force prices lower.
Disclaimer: The information presented does not constitute financial, investment, trading, or other types of advice and is solely the writer’s opinion