Ethereum’s past tells all: Is ETH poised for massive rally?
Ethereum is showing signs of a rebound, with technical patterns indicating a breakout.

- A symmetrical triangle and ascending trendline hint at an upcoming bullish rebound for Ethereum.
- Ethereum’s leverage ratio and open interest show key trends that could influence price movements soon.
Ethereum [ETH] has been mirroring the overall market dynamics closely, experiencing a notable bounce in price recently.
Following Bitcoin’s [BTC] movements, Ethereum is gradually recovering from a week-long dip that saw the asset decline by 7.2%, bringing its price below the $2,400 mark.
At the time of writing, ETH has managed to reclaim some ground, trading at $2,451 with a modest gain of 1.1% over the past 24 hours.
Amidst this price recovery, a well-known crypto analyst going by the name Trader Tardigrade recently shared insights on Ethereum’s price chart.
The analyst pointed out that ETH has been tracing an ascending trendline since June 2022, exhibiting a consistent pattern.
Ethereum to rebound soon?
According to the analyst, every time Ethereum neared this trendline, the price action formed what’s known as a Symmetrical Triangle pattern before bouncing upwards.
The current market activity shows the formation of another Symmetrical Triangle just above this trendline, hinting at the possibility of an imminent rebound for Ethereum.
Tardigrade’s analysis suggests that ETH is approaching a crucial support zone, with this triangle formation potentially providing the momentum needed for an upward breakout in the coming days.
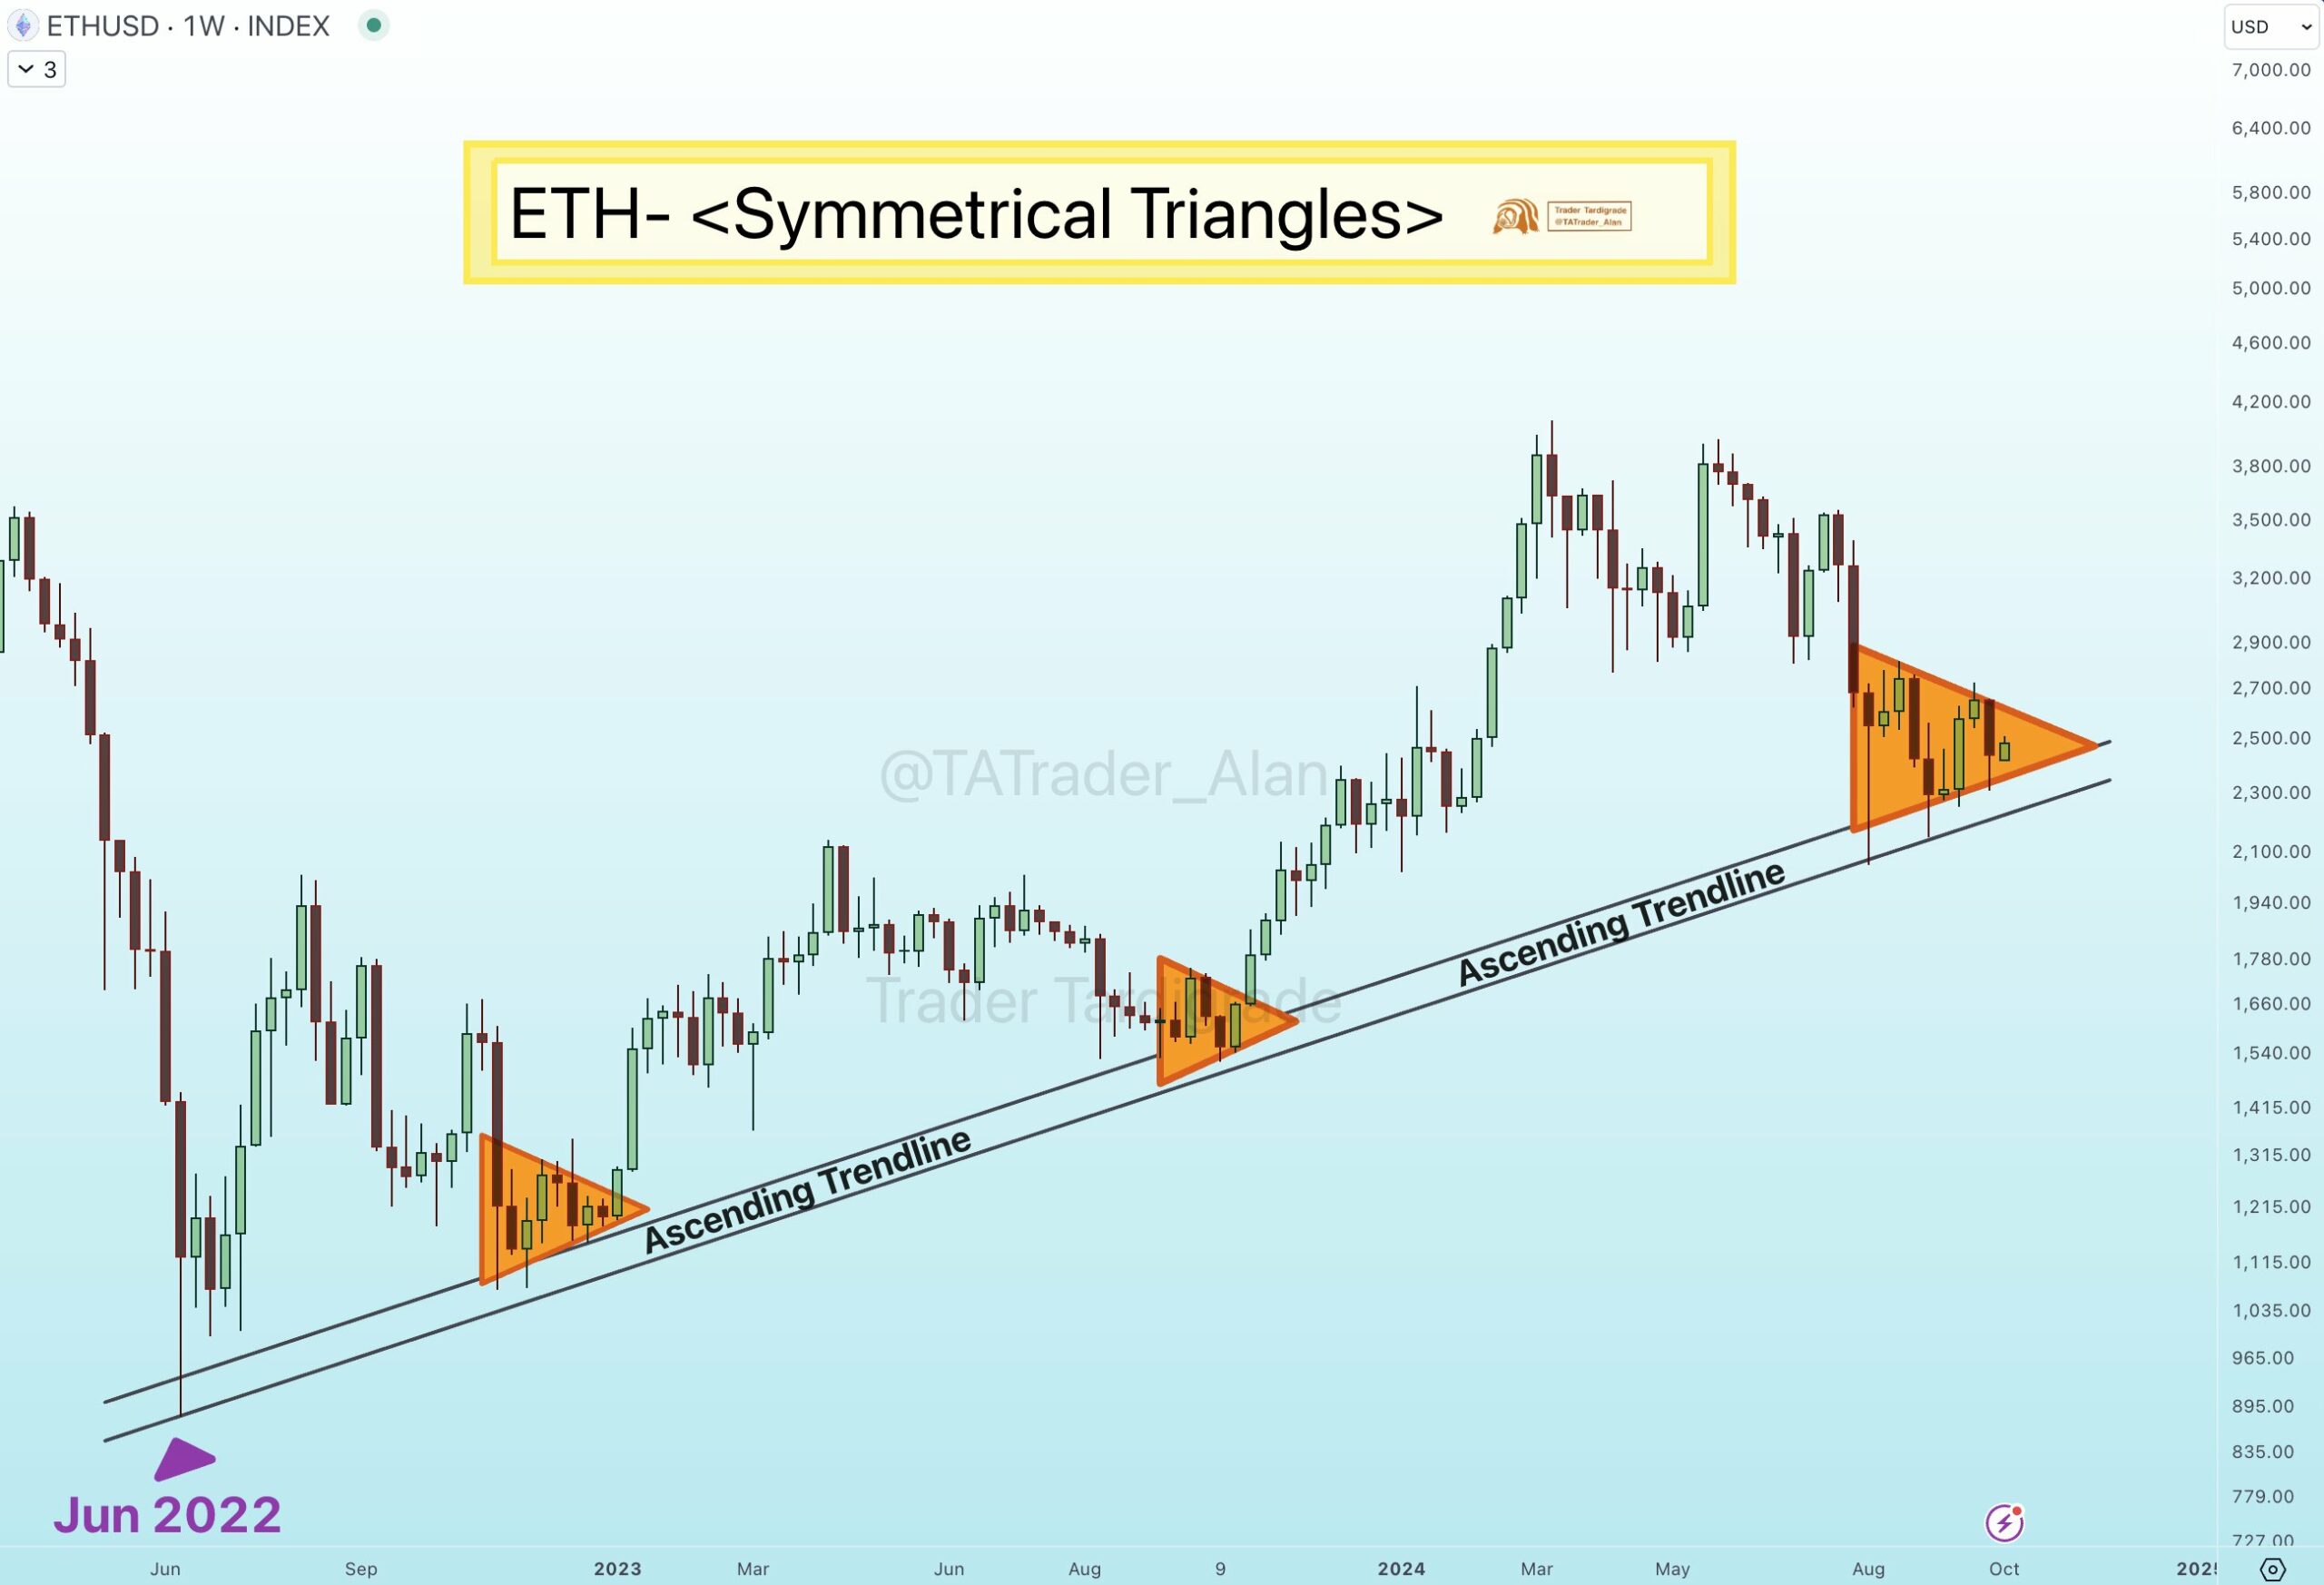
In technical analysis, an Ascending Trendline is a straight line drawn to connect at least two or more price lows.
It indicates an upward movement, where each low is higher than the previous one, suggesting bullish market momentum over time.
A Symmetrical Triangle, on the other hand, is a chart pattern characterized by converging trendlines, indicating a period of consolidation before a breakout.
This pattern typically forms when the market is indecisive, but a breakout in either direction often follows once the consolidation phase ends.
The repeated appearance of these symmetrical triangles in Ethereum’s price chart, coupled with its positioning above the ascending trendline, implies a potential bullish breakout is on the horizon.
ETH’s fundamental outlook
Beyond the technical indicators, Ethereum’s fundamental metrics also offer valuable insights into its potential trajectory.
According to data from CryptoQuant, the estimated leverage ratio of Ethereum has been on the rise over the past month, with the figure currently standing at 0.361.
This ratio represented the amount of leverage traders are using, calculated as Open Interest divided by exchange reserves.
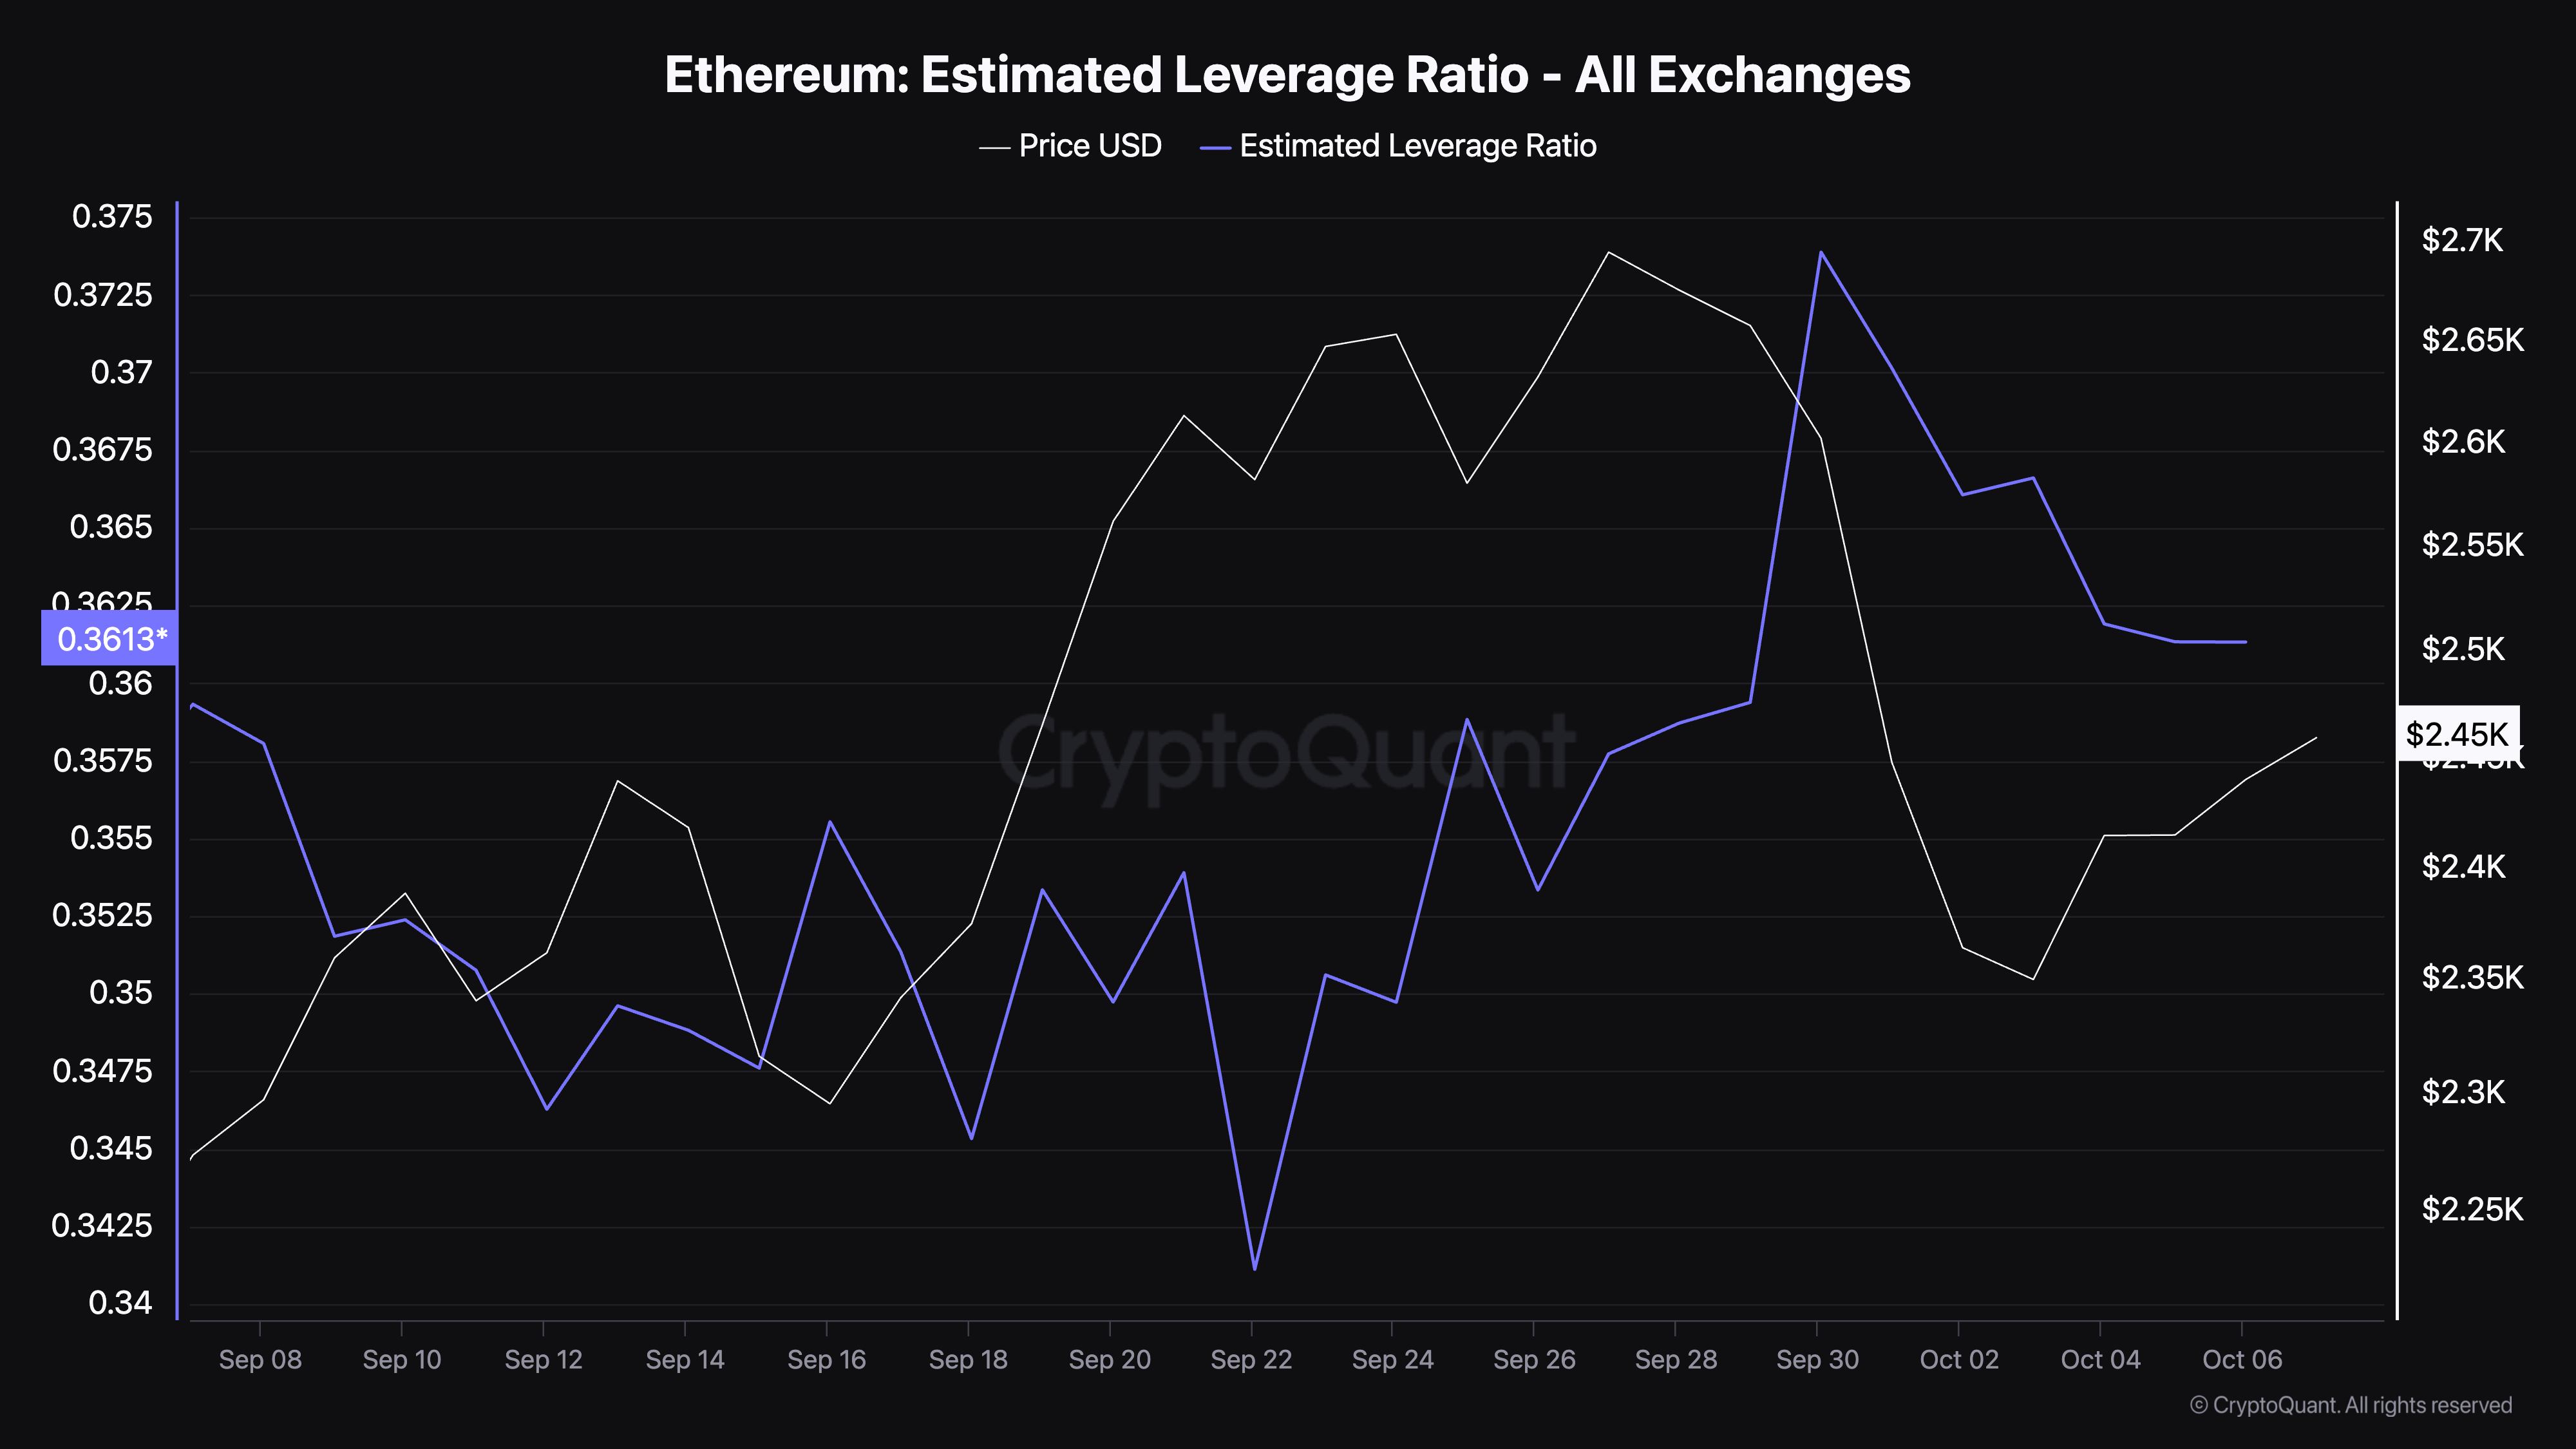
An increase in this ratio implies that more leverage is being applied, often signifying higher expectations for price volatility.
While this can lead to higher gains if the price moves in the expected direction, it also increases the risk of liquidation if the price shifts unfavorably.
To further assess Ethereum’s market health, a look into its open interest reveals mixed indicators.
Open Interest, which represents the total number of active derivative contracts, has experienced a slight decline of 0.21%, standing at a valuation of $11.38 billion according to Coinglass.
However, Ethereum’s Open Interest volume has surged by an impressive 120%, now valued at $18.38 billion.
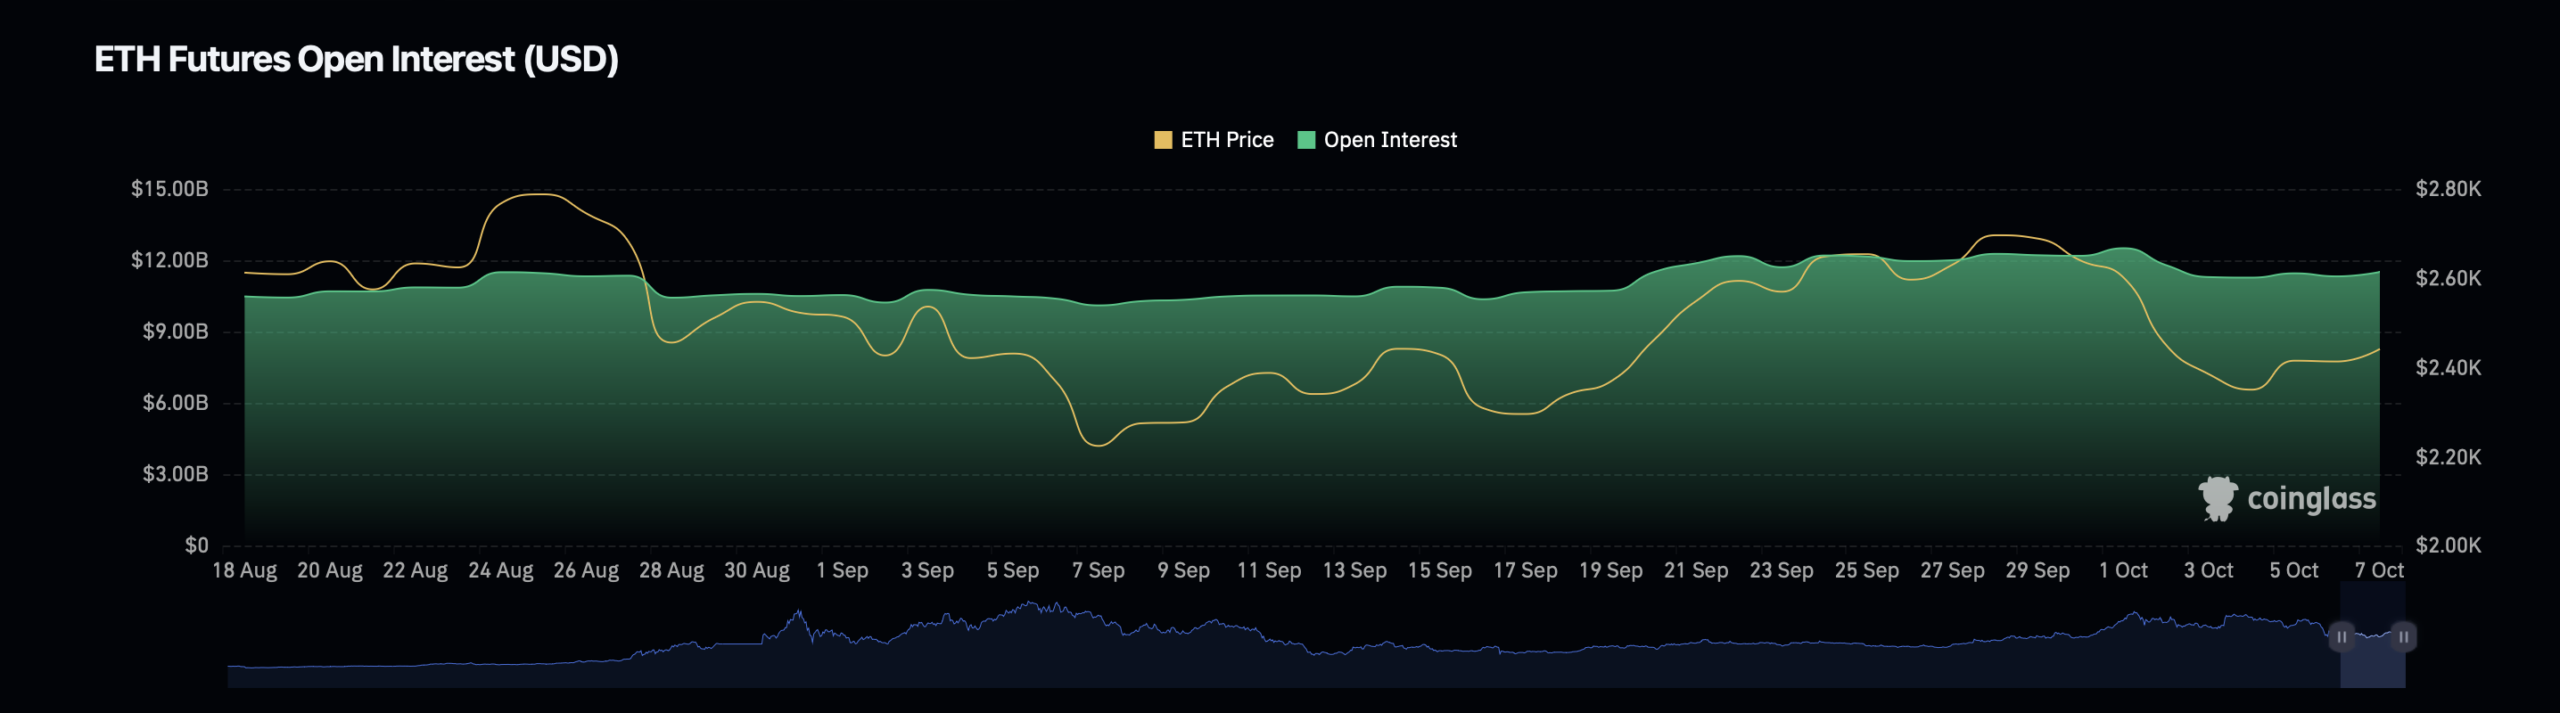
This divergence suggests that while the number of open contracts has decreased, the trading volume and activity surrounding these contracts have intensified significantly.
The decline in Open Interest could point to a phase of reduced speculative activity, often occurring when traders close their positions to avoid increased market uncertainty.
Read Ethereum’s [ETH] Price Prediction 2024–2025
Conversely, the surge in volume may indicate that traders are actively engaging in the market, potentially positioning themselves for Ethereum’s next major price movement.
This mix of reduced speculative positions but heightened volume activity implies that market participants are consolidating their positions, likely in anticipation of a more decisive price action in the near future.