Mapping how DOT can finally breach $4.98 on the charts
Despite some bullish momentum on the charts, DOT's rally to $4.98 remains conditional.

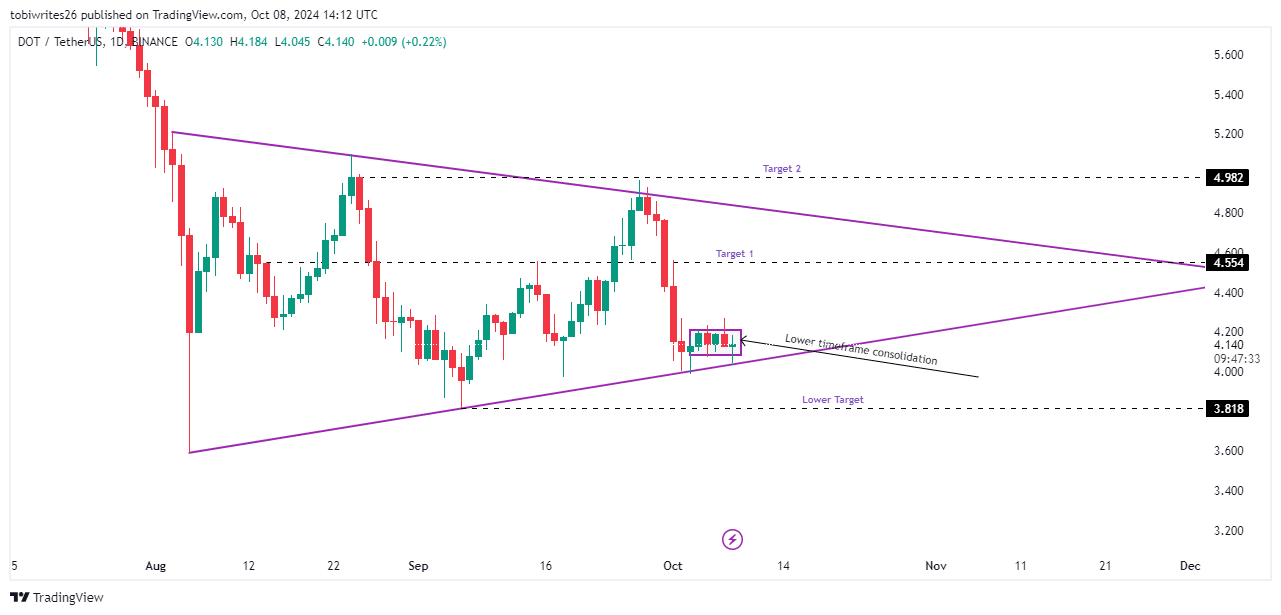
- At the time of writing, DOT was trading within a four-hour consolidation phase and at a major support line, signaling a bullish outlook
- Accumulation and distribution (AD) ratio traded within a pattern that will determine its rally
Polkadot [DOT] has been sluggish since the beginning of the month, remaining within a consolidation phase on the charts. The same was highlighted by its modest price changes – A 0.97% hike over the month, with the crypto gaining by just 1.57% in 24 hours.
Despite these movements, however, the future direction of DOT is dependent on a major breach from the different patterns that have surfaced.
Is a major rally imminent for DOT?
At press time, DOT was trading within a symmetrical triangle pattern, with price movements oscillating within a defined range. Despite historical uptrends from similar positions, DOT has instead consolidated at the triangle’s bottom support since 2 October.
Breaking out of this consolidation phase could propel DOT to two potential targets – The first at $4.554 and a subsequent level at $4.982. Without a breakout, DOT may revert to its September low of $3.818.
Overall market sentiment seemed fairly bullish too, suggesting an upward trend for DOT in upcoming sessions. Additional insights from AMBCrypto supported the likelihood of DOT’s sustained rise too.
Buying activity is confirmed, yet DOT’s rally remains conditional
The Accumulation and Distribution (AD) technical indicator was trending upwards, indicating ongoing accumulation. Its findings aligned with the consolidation phase identified earlier on the chart.
For a bullish breakout, the AD line must breach the upper resistance line of the triangle pattern within which it trades. If this occurs, greater buying activity can be expected, potentially driving DOT’s price higher.
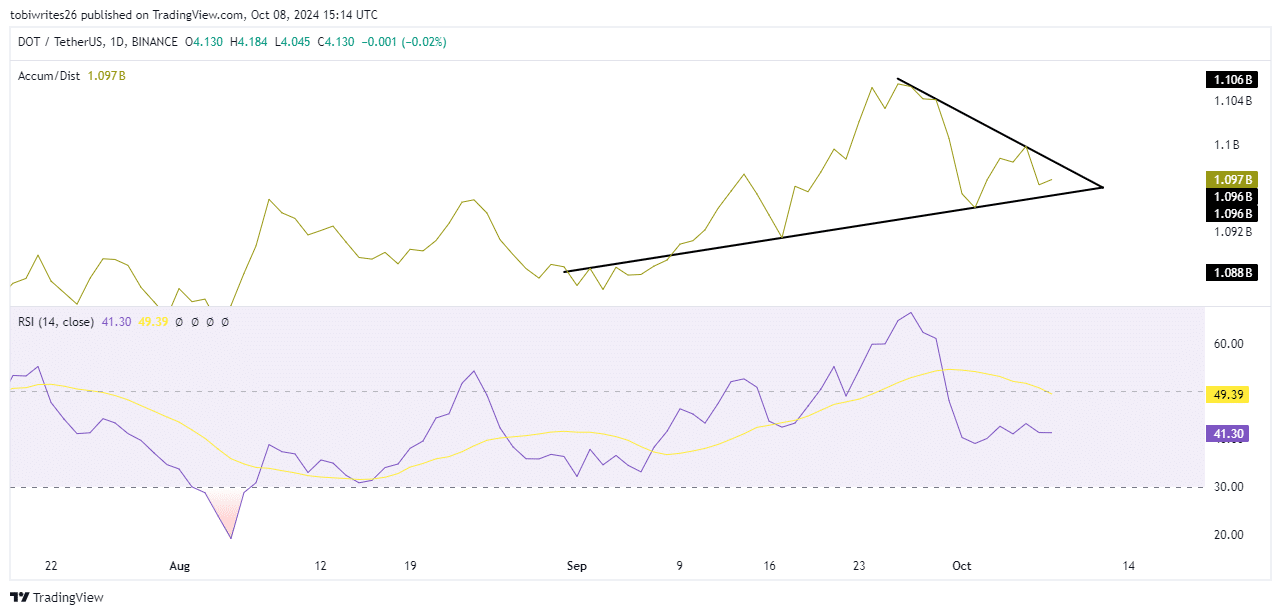
Moreover, the Relative Strength Index (RSI), which measures the velocity of price changes, has been progressing higher. This means that the price of DOT is likely to continue its upward trend, possibly breaking through the upper bounds of the consolidation channel.
Interest in DOT shifts towards bulls
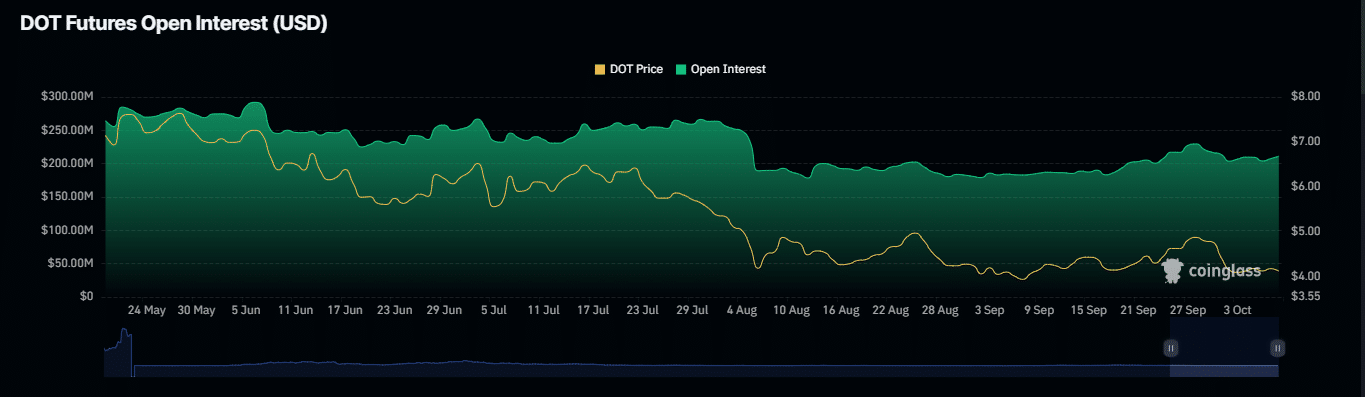
Open interest in DOT, which dipped to a monthly low on 6 October, has been steadily gaining momentum, as indicated by the charts on Coinglass.
This uptick can be interpreted as a sign of increasing bullish activity in the market, reinforcing the prevailing bullish sentiment.
At the time of writing, Open interest had fallen slightly by 1.03%, with the same valued at $209.93 million. If this uptrend continues, it may be set to reach new highs and enter positive territory.
Given these conditions, DOT can be expected to continue its rally, while also meeting and potentially exceeding its target prices.