Chiliz coin up 8% in 24 hours: Is $0.1 the next stop for bulls?
The mix of signals from the data from the past 24 hours showed that the short-term bias was bearish.

- CHZ has a bullish market structure on the daily and weekly timeframes.
- The recent uptrend could surge past $0.1 in the coming weeks.
Chiliz [CHZ] exhibited a bullish structure on the daily chart. The longer-term trend has been bearish, but that has begun to change over the past three weeks. The $0.6-$0.65 zone has been flipped to support.
A set of Fibonacci retracement levels was plotted based on the downtrend from May to August. AMBCrypto found that the current bullish targets were $0.118 and $0.139.
Influx of buying pressure sends CHZ prices higher
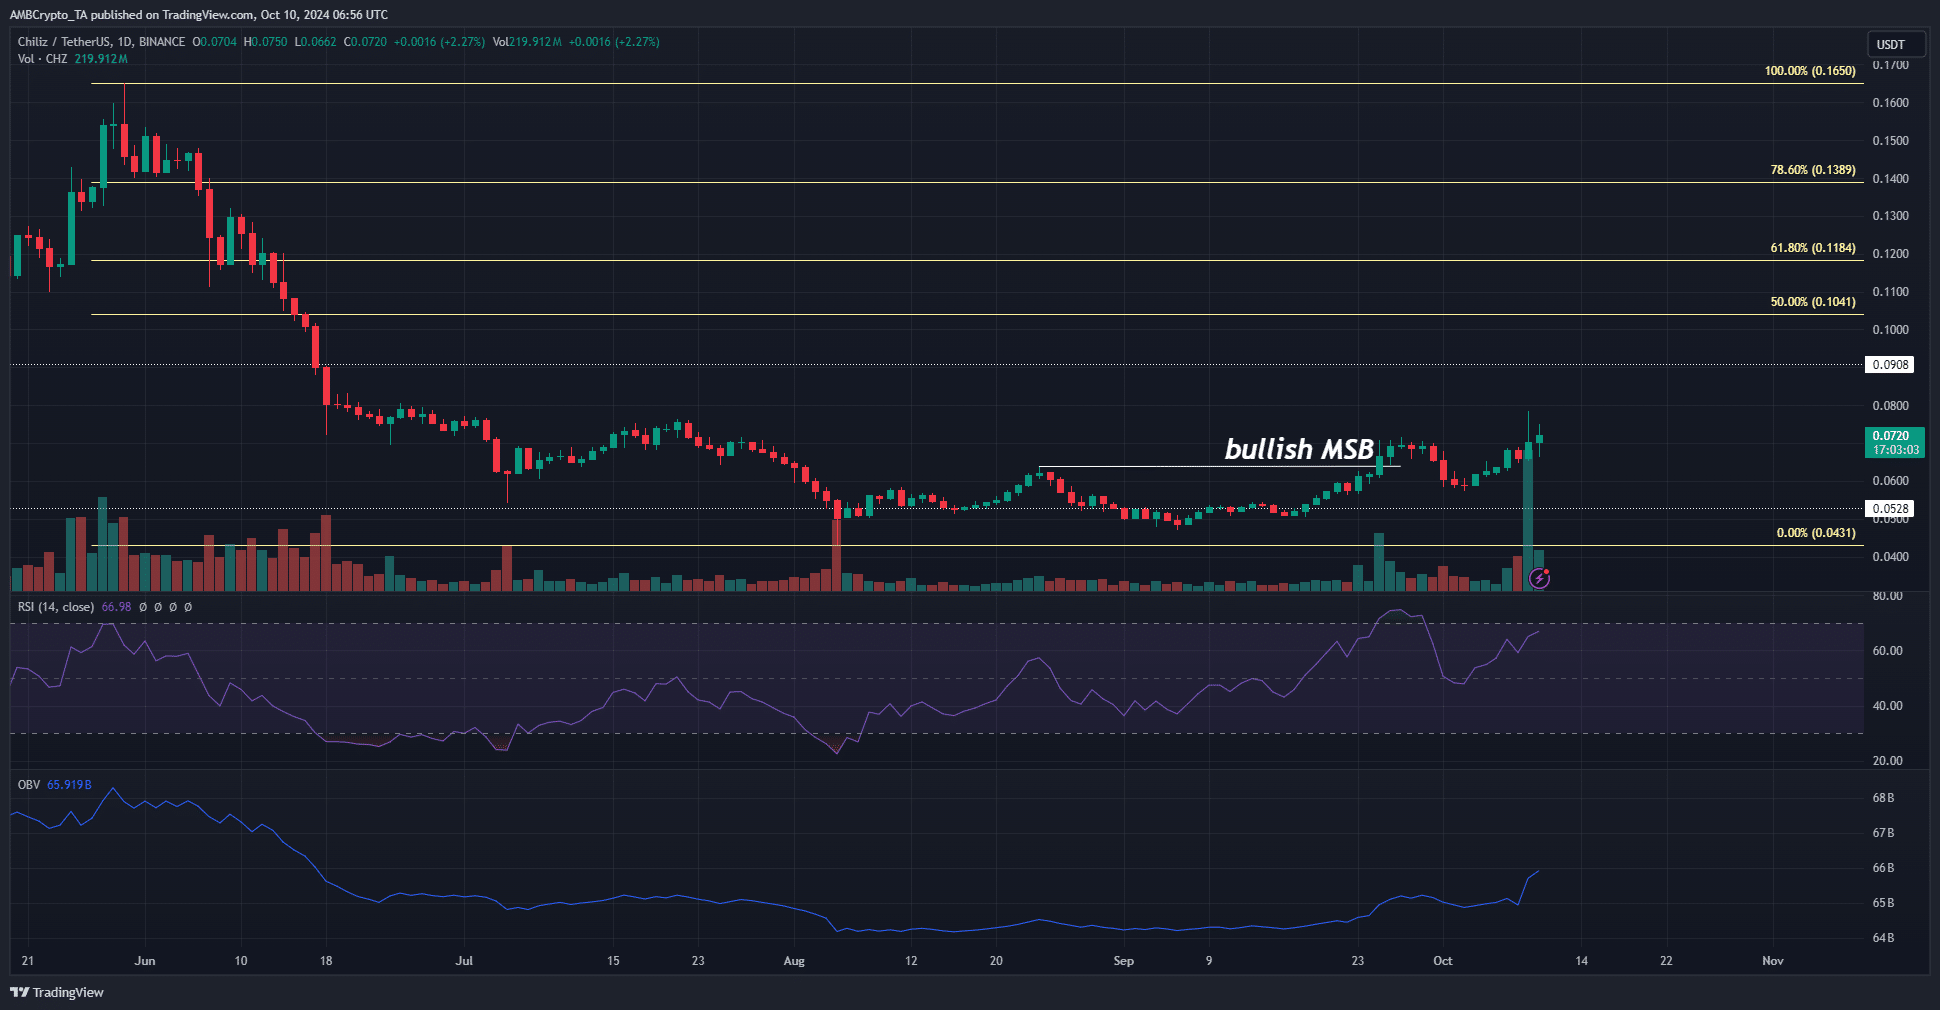
The bullish structure break on the daily occurred on the 25th of September. Since then, it fell back to the $0.6 level before bouncing higher by 23.7% in a week. The daily RSI has stayed above neutral 50 during the past two weeks, showing bullish momentum.
The OBV also saw a sizeable move higher since the 23rd of September. This was an indication of increased trading volume as prices trended higher, a sign of buying pressure.
The $0.76-$0.8 region is expected to pose some minor resistance to Chiliz coin but the bulls are likely to prevail. Further north, the psychological $0.1 level and the Fibonacci retracement levels beyond it could be trickier.
Declining spot CVD raises concerns
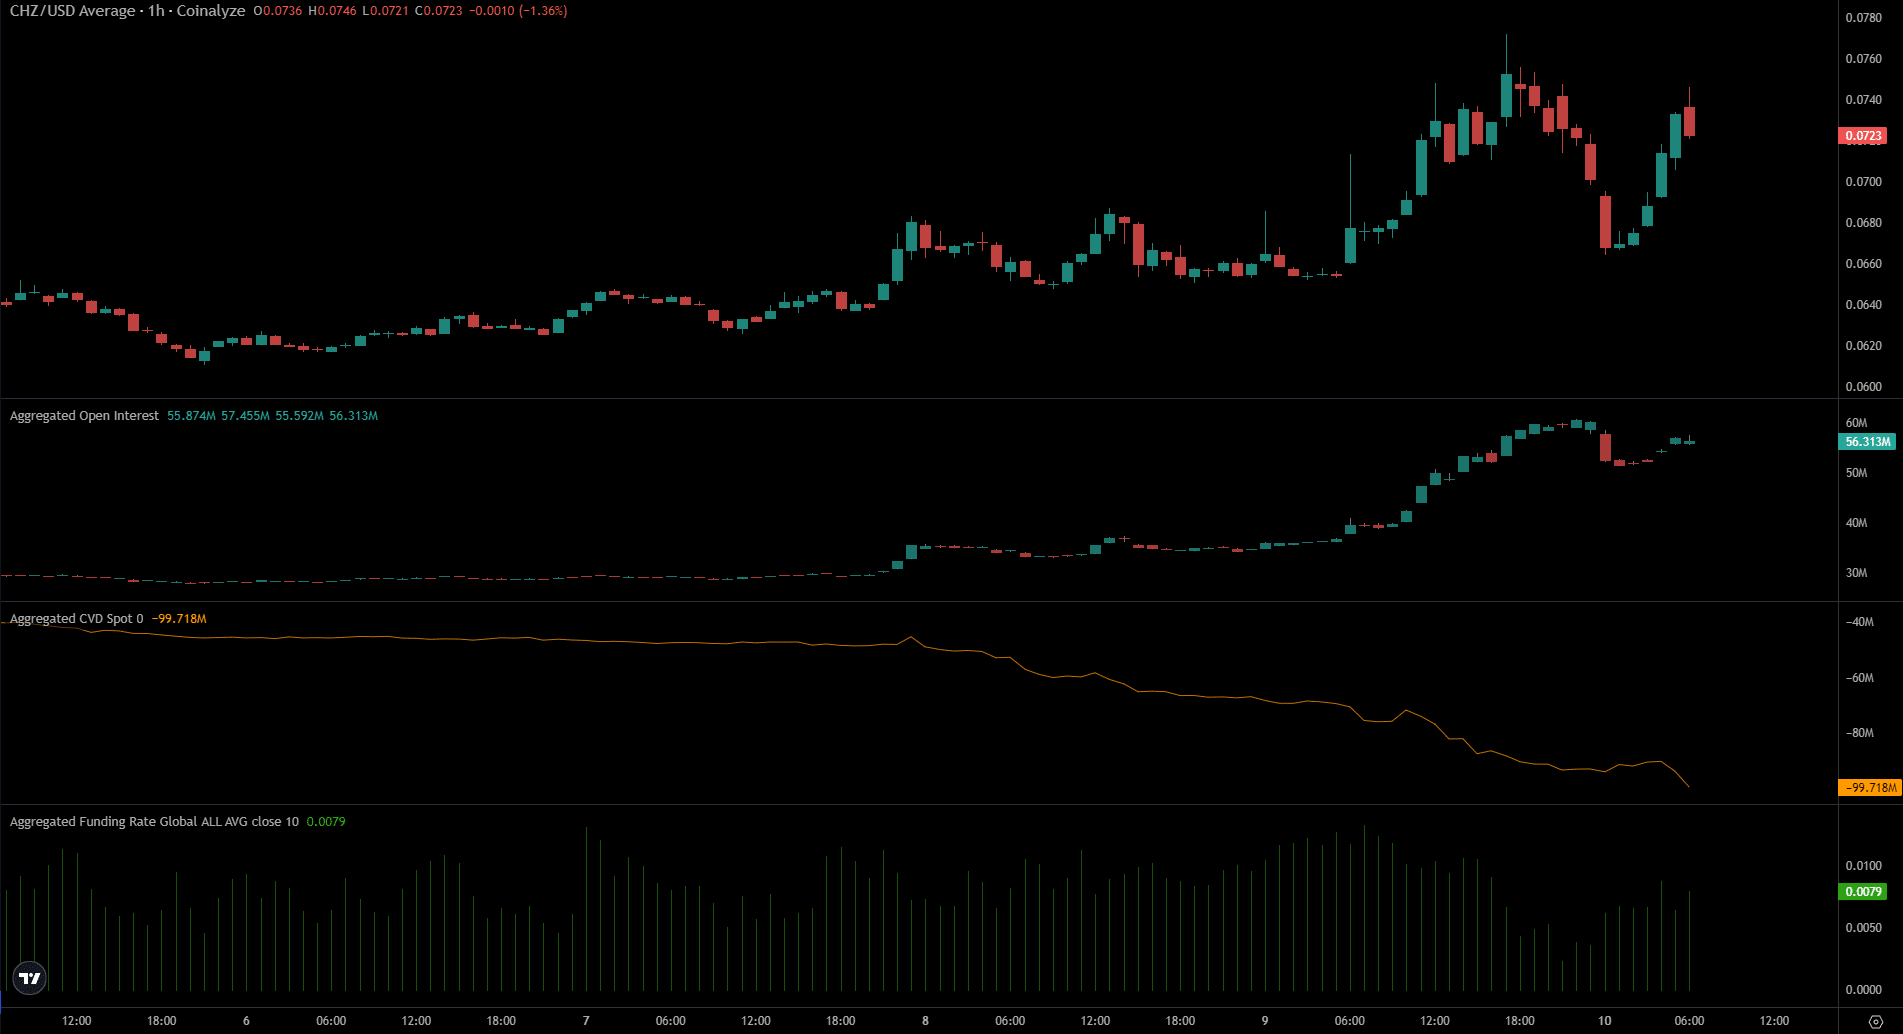
The surging Open Interest and the price spike over the past week was a sign that sentiment had been bullish. However, the rejection at $0.75 on the 9th of October saw the sentiment flip strongly bearish.
Read Chiliz’s [CHZ] Price Prediction 2024-25
During this price rejection, the OI continued to pile higher. At the same time, Bitcoin [BTC] began to drop from $62.3k. This indicated that short sellers were willing to short CHZ, which explained the few hours the OI continued to rise.
The spot CVD was in a steady downtrend, although the funding rate remained positive. Taken together, the mix of signals from the data above outlined a short-term bearish bias.
Disclaimer: The information presented does not constitute financial, investment, trading, or other types of advice and is solely the writer’s opinion


