Is Solana’s downward trend halting? This price level holds the answer!

- While price continues to drop, a significant support level at $136.15 could halt and possibly reverse the trend.
- Indicators present conflicting signals; some point to a reversal whereas others indicate decline.
Solana [SOL] has moved slowly for most of the month, with only a slight gain of 3.43%, likely due to trading within a consolidation channel. However, in the last few trading sessions, the struggle has been more apparent, with a modest weekly gain of 0.45% and a daily decline of 2.43%.
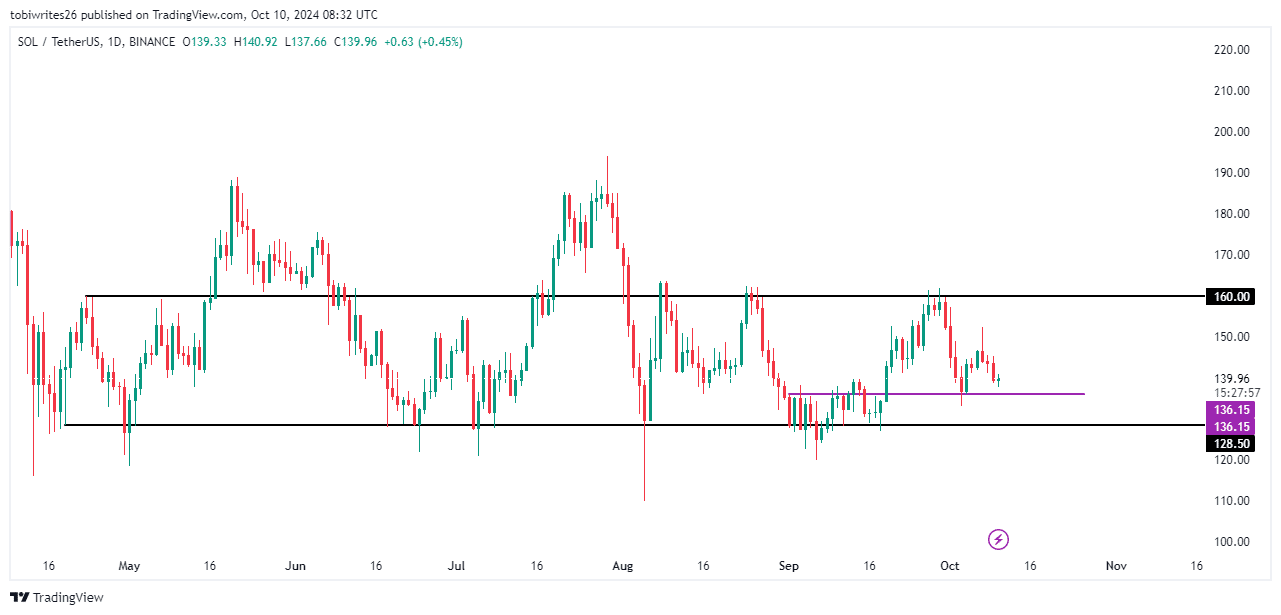
Although the market typically expects SOL to drop further, reaching the bottom of the consolidation channel between $128.50, additional factors should be considered.
SOL chart presents a decline set-up
According to the chart for Solana, it has recently reacted off the resistance level within its consolidation channel. This channel is characterized by price fluctuations between established support and resistance levels.
After bouncing off the resistance, the price has been trending downward and is typically expected to reach the support level at 128.50, a pattern observed on several occasions.
However, the formation of a minor support line within the consolidation channel at $136.15 offers potential for a Solana rally if sufficient buying pressure drives this change.
At this point, AMBCrypto has observed varied reaction in trading activities, placing SOL on a somewhat uncertain trajectory — whether the $136.15 support will hold or not.
Indicators signal downturn for Solana, yet the depth is unclear
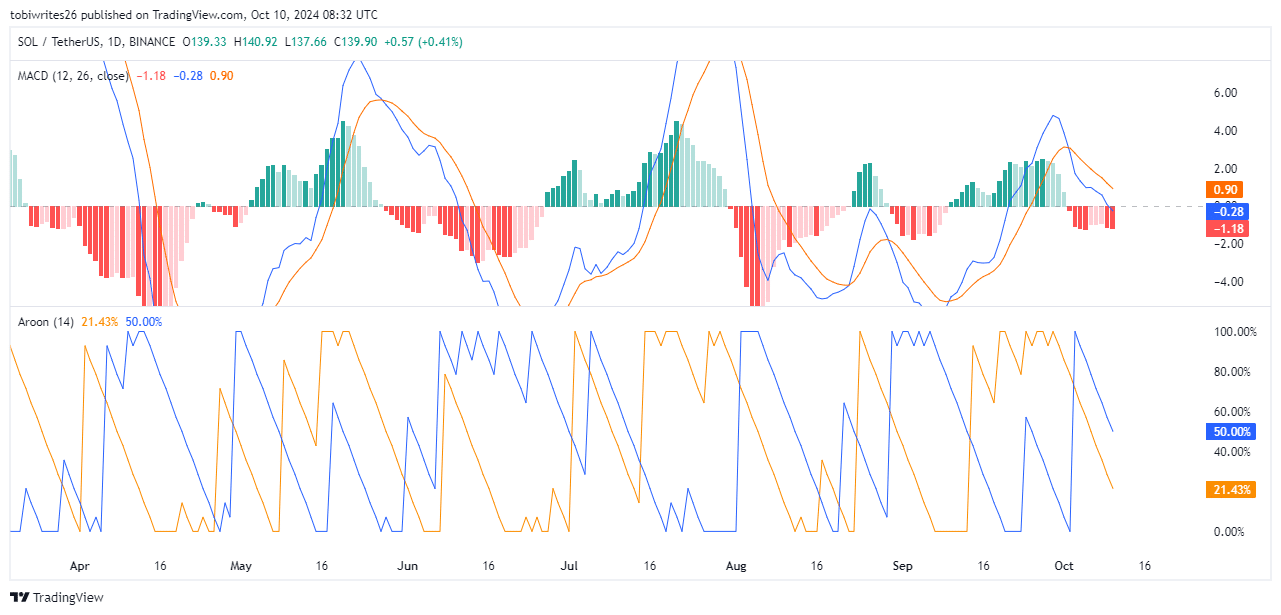
Technical indicators are hinting at a continued downward movement for SOL, driven by strong bearish sentiment. Notably, the Moving Average Convergence Divergence (MACD) and the Aroon line are signaling this potential drop.
The Aroon indicator, which features an orange ‘Aroon Up’ line and a blue ‘Aroon Down’ line, tracks the time between highs and lows to assess the trend’s strength and direction.
With the Aroon Down line currently higher than the Aroon Up, the market appears to be in a bearish phase for SOL.
The MACD further supports this outlook, as it trends downward with increasingly negative momentum bars and the blue MACD line crossing below the signal line.
These trends suggest that SOL is set for a drop as more trading unfolds. The exact extent of the fall remains uncertain; depending on further market dynamics, it could either stabilize at the nearby support level of 136.15 or potentially dip as low as 128.50.
Meanwhile, AMBCrypto found that on-chain metrics indicate a growing bullish sentiment among traders, with an uptick in long positions and ongoing maintenance of existing ones.
Selling pressure on SOL eases
According to on-chain data from Coinglass, the tendency for SOL to decrease further has reduced, and selling pressure is diminishing as bulls begin to take control.
The open interest, which tracks unsettled derivative contracts—futures contracts in this instance—has increased by 5.21% to $2.25 billion. This suggests a rise in long positions, potentially driving the price forward.
Read Solana’s [SOL] Price Prediction 2024–2025
Concurrently, the funding rate has turned positive, now at 0.0021%. A positive funding rate implies that long traders are paying short traders, anticipating a price increase.
If these bullish indicators continue, SOL could be well-positioned for a rally, with the nearest support at the 136.15 level likely holding. Conversely, a shift to negative could see SOL dropping to the lower support level at 128.50.


