How Polkadot buyers can navigate DOT’s price downturn

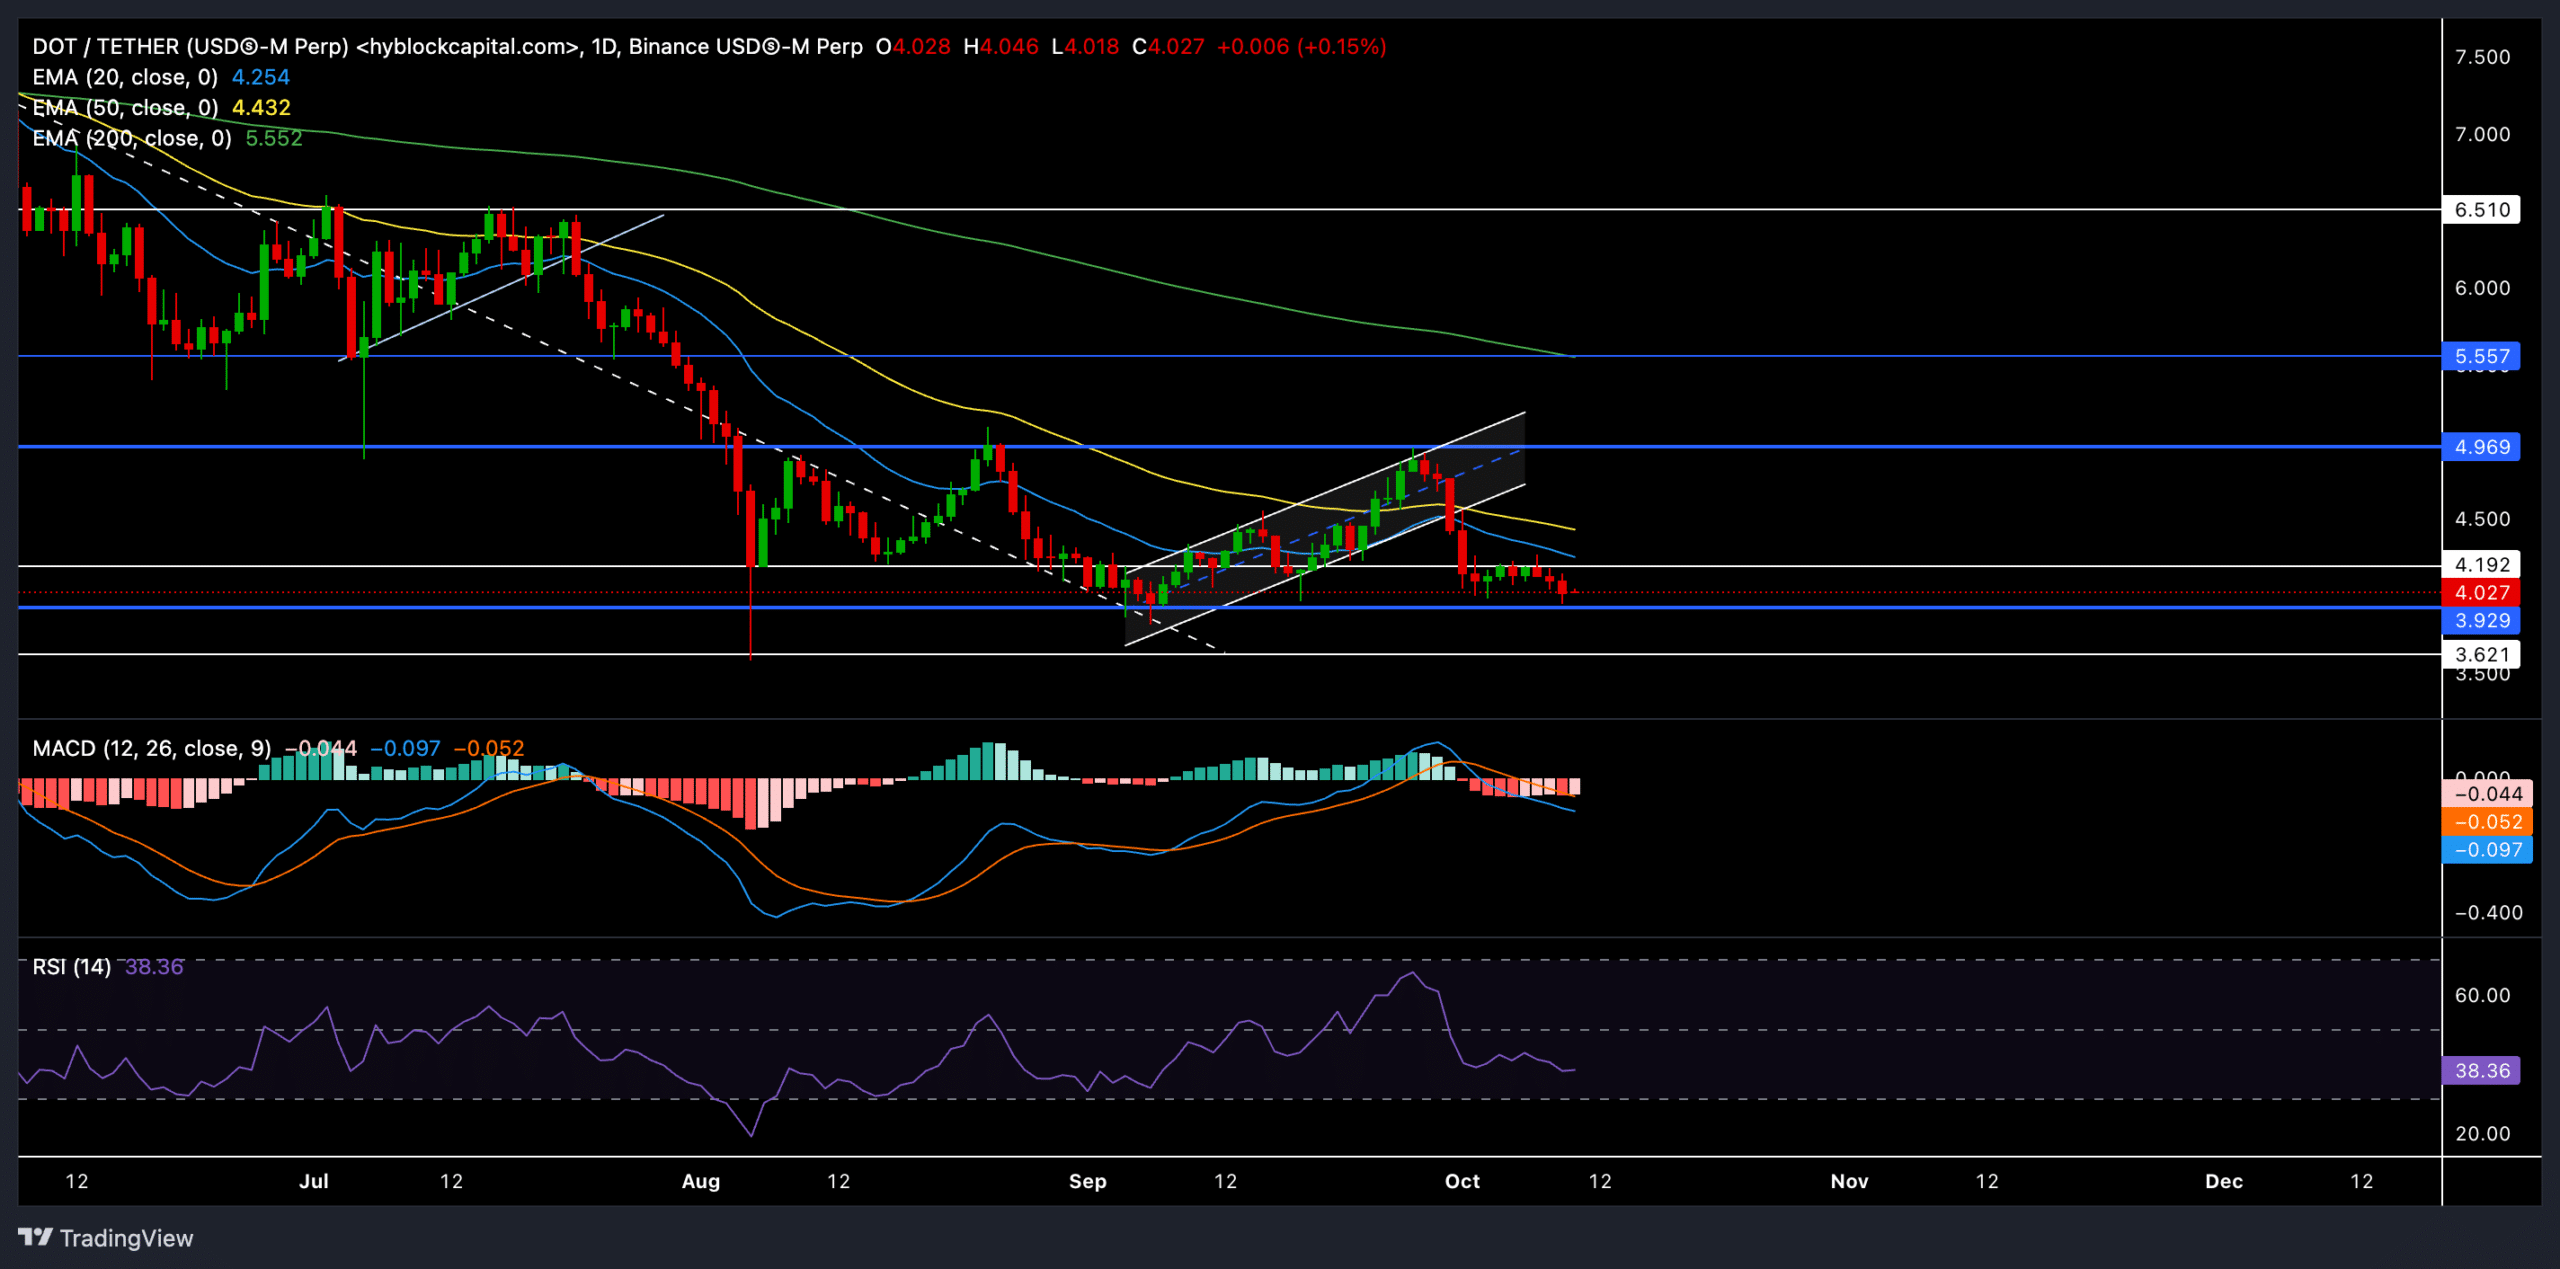
- Polkadot’s recent price action reaffirmed the bearish edge after breaking out of an ascending channel
- A close below $3.9 could lead to more losses, while reclaiming key EMAs may offer a glimmer of hope
Polkadot (DOT) faced continuous rejection from the $4.1 resistance, while struggling to gain momentum amid broader market uncertainties. The recent downturn from this resistance has put DOT at risk of further downside, mainly as it hovered around key support levels.
DOT was trading at approximately $4.03 at press time, down by 1.3% over the last 24 hours.
Can DOT bulls defend key support?
DOT recently faced resistance near the $4.1 level after bulls failed to overcome the EMA resistances. This triggered a pullback and DOT, at press time, was trading below the 20-day and 50-day EMAs, both of which have been acting as immediate hurdles. As the near-term EMAs continued to look south, the coin’s near-term tendencies depicted increasing selling pressure.
If DOT closes below the $3.9 support level, the coin could be exposed to further losses, potentially retesting the multi-year low range of $3.5-$3.6. A breakdown below this level could open the door for even deeper corrections.
However, if bulls manage to reclaim the EMAs, it could prevent a further decline and offer an opportunity for a near-term recovery. A retest of the $4.9 resistance level (above the 50-day EMA) could be possible in such a case.
MACD recently saw a bearish crossover, one where the MACD line fell below the Signal line. This suggested that sellers still had the upper hand, at the time of writing. Similarly, the RSI reaffirmed this bearish edge. Buyers should wait for a close above the 50-mark before opening a long position.
Derivatives data revealed THIS
The 24-hour long/short ratio was 0.8671 at press time and indicated a slight bias towards short positions. On Binance and OKX, however, the long/short ratios were massively skewed in favor of bulls—at 5.4599 and 3.6. This underlined huge optimism among top traders on these platforms.
Here, it’s worth noting that DOT’s trading volume also rose by over 31% over the past day. The slight uptick in Open Interest (+0.46%) also suggested that traders kept their positions open, despite the recent volatility.
Finally, the liquidation data revealed a higher number of long liquidations, which might imply profit-taking and caution among traders as DOT failed to sustain momentum above $4.1. It’s crucial to consider Bitcoin’s movement and assess the overall market sentiment before opening any positions in the short term.


