Mapping Polkadot’s future: Is DOT following Fantom’s path?
Polkadot has experienced a significant comeback over the past week, leaving analysts eyeing a 357.67% rally to $20.

- DOT has surged by 6.36% on weekly charts.
- An analyst eyed a historical surge, citing Fantom’s historical pattern.
After a sustained decline, Polkadot [DOT] has made a strong back over the past week. Since hitting a low of $3.9, DOT has seen a strong upsurge, hiking by 12.82%.
Equally, the altcoin has flipped SMA on daily charts, indicating a strong upward momentum.
At the time of writing, DOT was trading at $4.37. This marked a 3.63% increase over the past day, with an extension to this bullish trend by 6.36% on weekly charts.
Prior to this, DOT had been on a downward trajectory declining by 2.12% on monthly charts.
However, the markets have shown strength over the past day with increased demand for the altcoin. Thus, DOT’s trading volume has surged by 12.30% to $133.93 million. Also, its market cap increased by 3.78% over this period.
As expected, these recent market conditions have rejuvenated the crypto community. Inasmuch, popular crypto analyst Ali Martinez has suggested Polkadot is ready to rally, citing Fantom’s historical pattern.
Market sentiment
In his analysis, Martinez posited that DOT could be following Fantom’s footsteps.
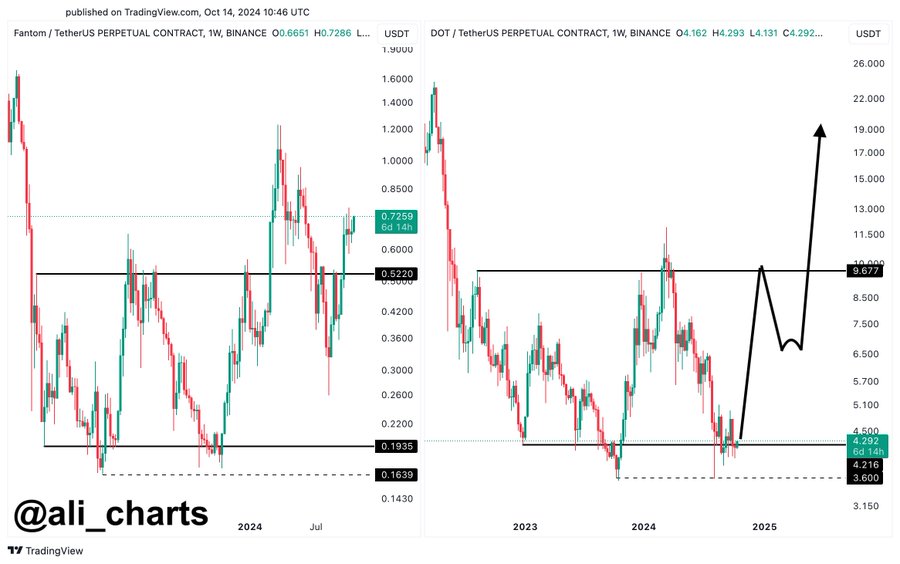
According to him, if the current pattern holds, DOT could rise to $9.7, retrace to $6.7 and then rally to a year high of $20.
In context, Fantom experienced an exponential surge based on this pattern hiking by 192.31% from a local low of $0.26 to $0.76.
Therefore, based on this analogy, DOT could surge by 357.67% holding the pattern constant.
What DOT charts says
As observed by Martinez, Polkadot is experiencing favorable market sentiment that could the altcoin for an exponential surge.
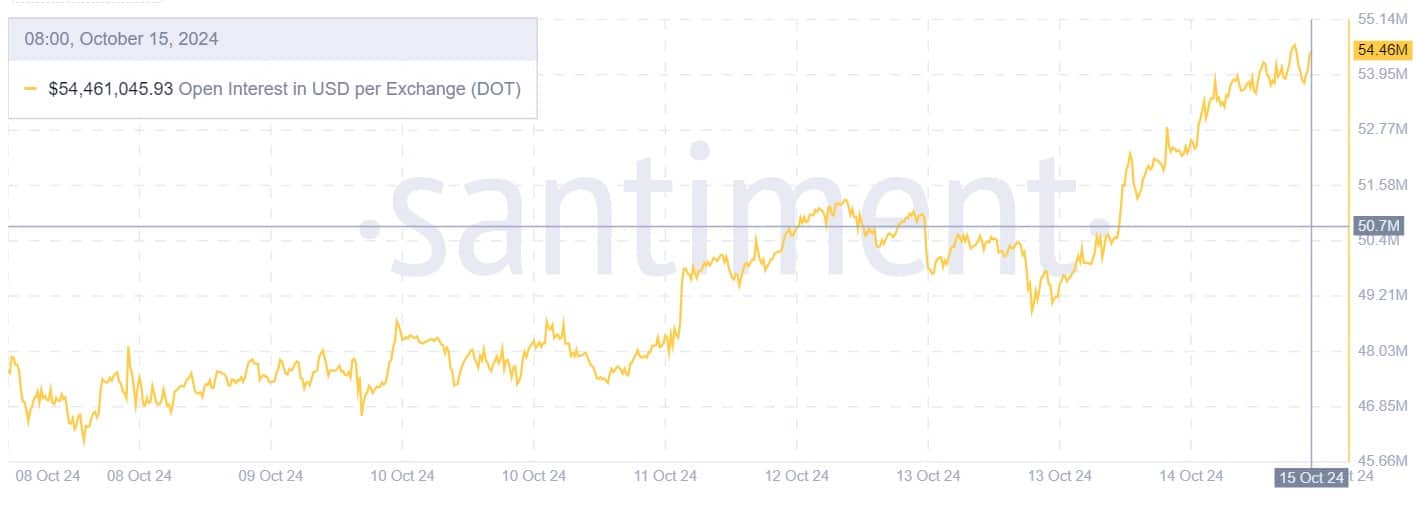
For example, Polkadot’s Open Interest in USD per Exchange has experienced a sustained increase over the past week. The altcoin’s Open Interest has increased from $46 million to $54.46 million at press time.
This implies that investors are bullish as they open new positions while holding the existing ones.
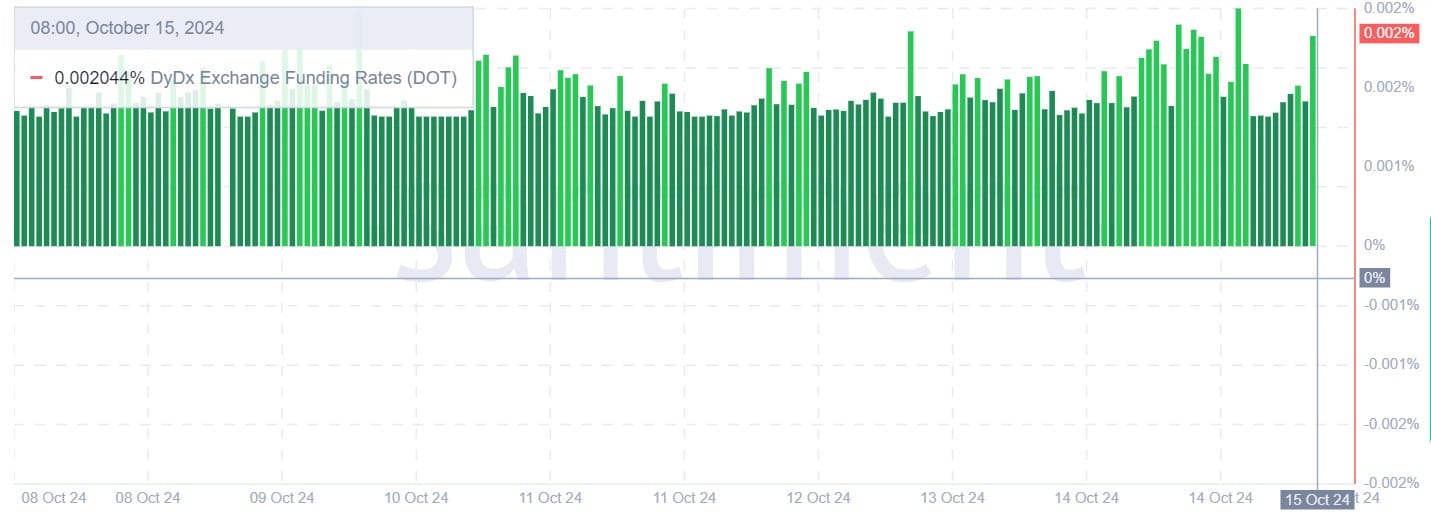
Additionally, Polkadot’s DyDx exchange Funding Rate has remained positive over the past week. This suggests that more investors are taking long positions compared to those going short.
Such a trend implies that investors anticipate prices to rise in the near term.
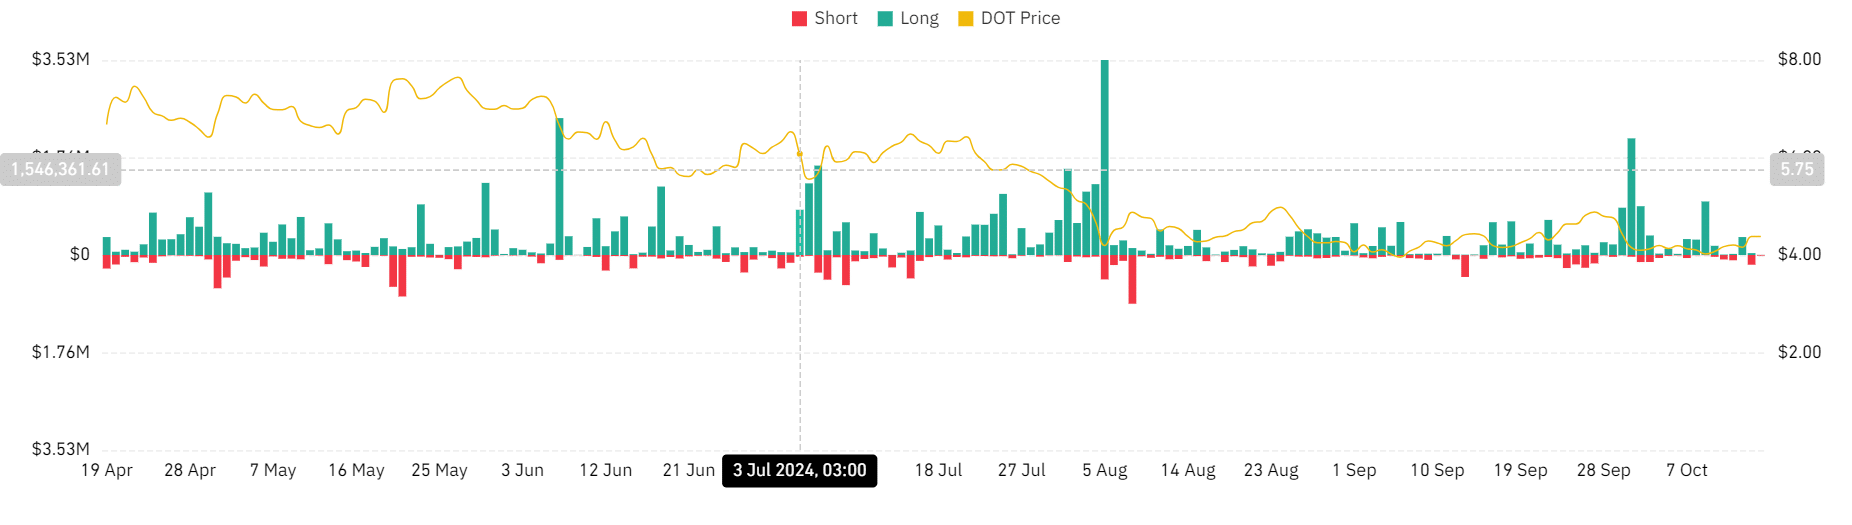
Finally, this demand for long positions is further supported by declining liquidation for long positions. Over the past two weeks, liquidation for longs has declined from $2.1 million to $2.36k at press time.
This shows that longs are paying shorts during market downturns to hold their positions.
Polkadot’s [DOT] Price Prediction 2024–2025
What Next for Polkadot?
Undoubtedly, DOT is experiencing a strong upswing. With positive market sentiment, the altcoin could record more gains. As such, the altcoin has faced multiple rejections at $5.0.
A breakout from this level will see the altcoin hit $6.5 in the short term. In a very bullish scenario, Polkadot will reclaim June highs at $7.3.


