XRP shows bullish signs: Key levels to watch for a breakout to $0.66
XRP is now faced with a potential breakout that could lead to a rally to as high as $0.66, according to a technical pattern.
- XRP is trading in an ascending channel pattern, which could lead to a rally toward $0.66.
- XRP’s RSI currently sits at 60, suggesting the asset may be poised for a potential price surge.
XRP has been on a gradual increase in recent weeks, while the asset hasn’t seen a major decline in price, it has also not risen significantly over the past weeks.
So far, XRP has increased by 5.2% in the past two weeks and 2.3% in the past week—although the past day performance has been slightly different with XRP seeing a slight decrease in price.
Regardless of this, technical analysis on XRP’s chart reveals that the asset could soon surge to as high as $0.66 as long as key support levels hold strong.
The bullish technical picture
A technical analysis on XRP’s chart reveals that the asset is showing a bullish signal. Specifically, XRP is facing the odds of surging to as high as $0.66 in price. This could be possible as long as XRP holds the support level of $0.52.
To put this into context so as to understand: on the 4-hour chart, XRP has so far trended sideways for a while now therefore forming an ascending channel pattern. This ascending channel pattern is a bullish signal especially if an asset breaks above it.
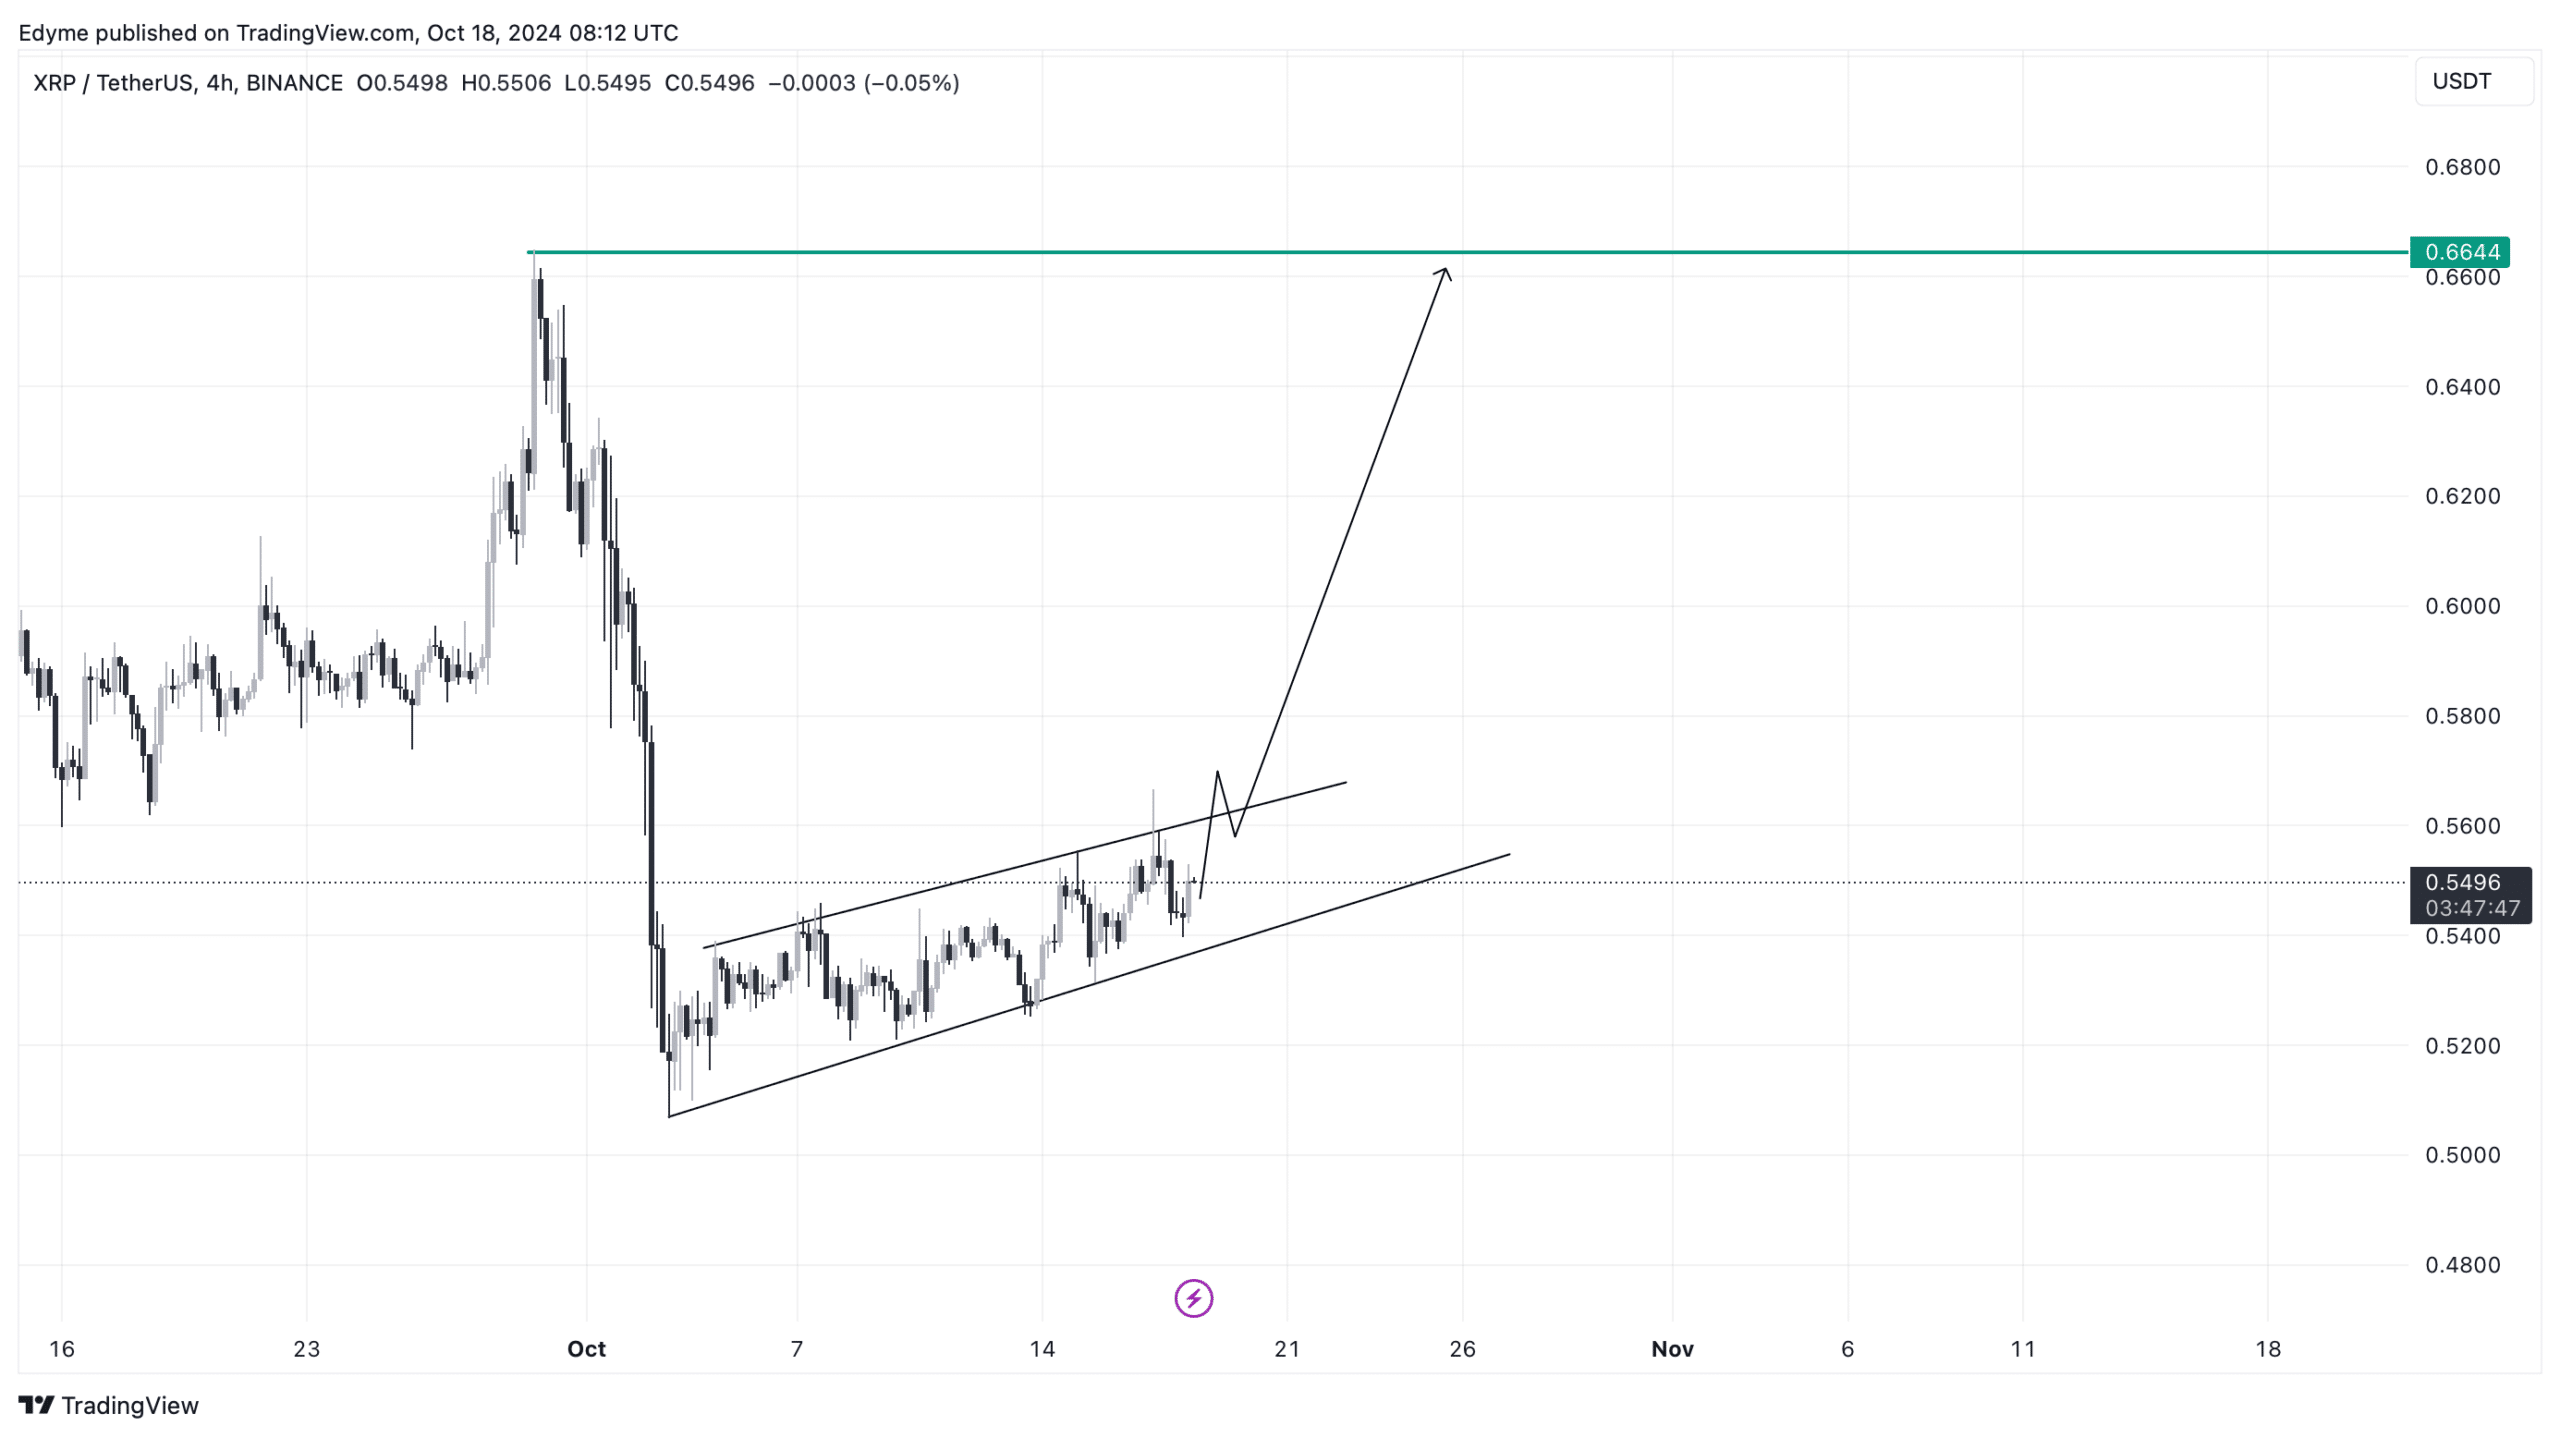
Now, with XRP forming this ascending channel pattern on its 4-hour chart, the asset is now facing the odds of rising to as high as 0.66 as long as it breaks above and have a candle close above the upper boundary of the ascending channel pattern which is $0.56 area and as long as XRP also maintain its price and hold above the lower boundary of the ascending channel pattern which $0.52.
Notably, the ascending channel pattern is a common formation in technical analysis, where price trends higher in a rising channel. When an asset remains within this pattern, it indicates a bullish outlook.
If XRP manages to break above the upper boundary and close with a solid candle, it confirms the bullish scenario, increasing the chances of further gains. Maintaining support around $0.52 is essential for this momentum to continue.
Fundamental outlook on XRP
From a fundamental perspective, XRP’s market metrics are also reflecting promising signs. One key metric is the Relative Strength Index (RSI), which is currently at 60. RSI is a momentum indicator that helps assess whether an asset is overbought or oversold.
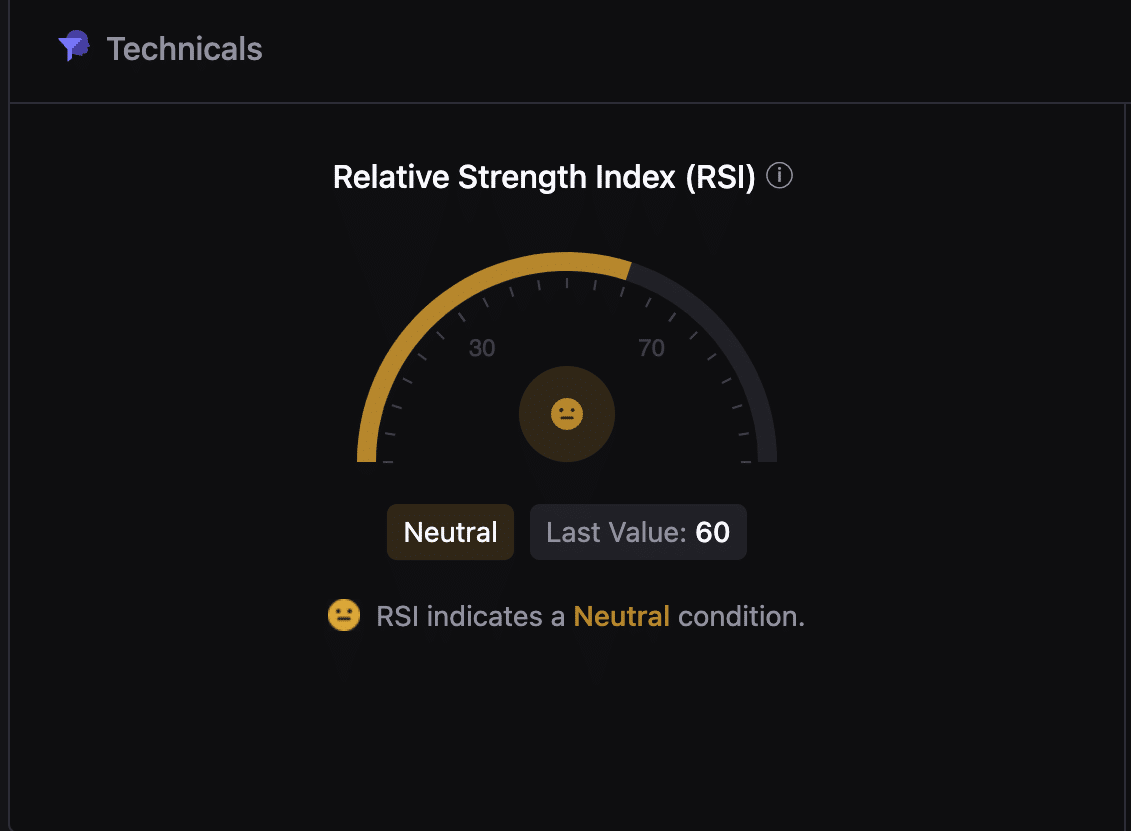
A reading of 60 suggests that the Ripple token is neither overbought nor oversold, placing it in a neutral condition. This balance indicates that there is still room for the price to rise further without entering an overbought territory, which could cause a pullback.
Read XRP’s Price Prediction 2024–2025
Another essential metric for XRP’s market sentiment is its active addresses, a reflection of retail interest in the asset. Data from Santiment shows that active addresses surged to over 250,000 in early August.
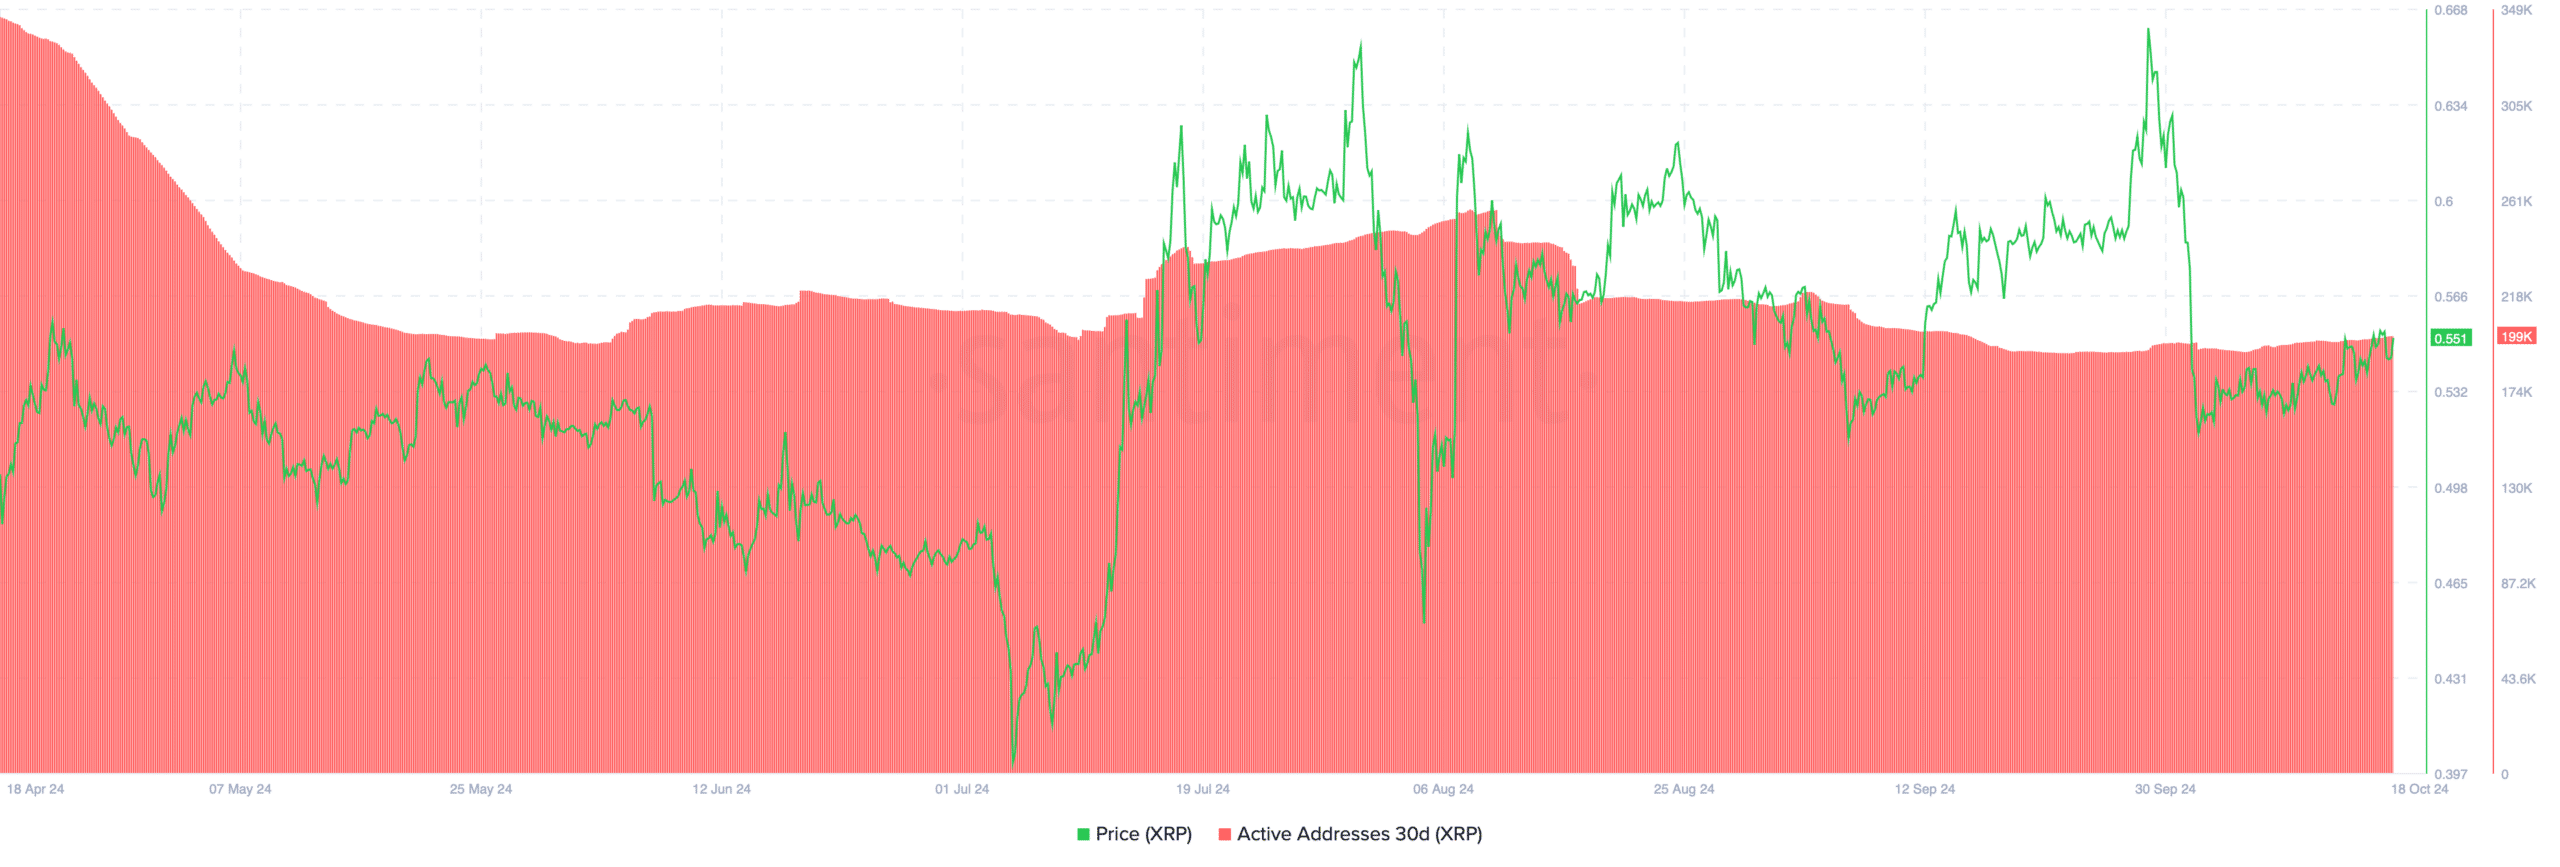
However, this figure has since decreased, stabilizing between 190,000 and 199,000 in the past few weeks. While this represents a slight drop in retail participation, the figure remains relatively strong, suggesting consistent market interest.


