Aptos shows bullish potential, but there is a problem with THIS price level
APT’s next move is still unfolding, with two possible scenarios in play.

- APT signals two likely outcomes at press time: a rally from its bullish pattern or a retracement toward a demand zone.
- However, the Relative Strength Index (RSI) suggests a conditional trend that could shape its upcoming price action.
Following a remarkable one-month performance, with gains of 70.82%, Aptos’ [APT] momentum has slowed. The asset struggled to breach a key resistance level after several attempts. Its daily price currently shows a modest 0.77% gain, reflecting waning enthusiasm compared to the previous week’s surge.
AMBCrypto notes that this phase of market indecision may soon end, with APT expected to take a decisive direction.
What’s next for APT? A move up or down?
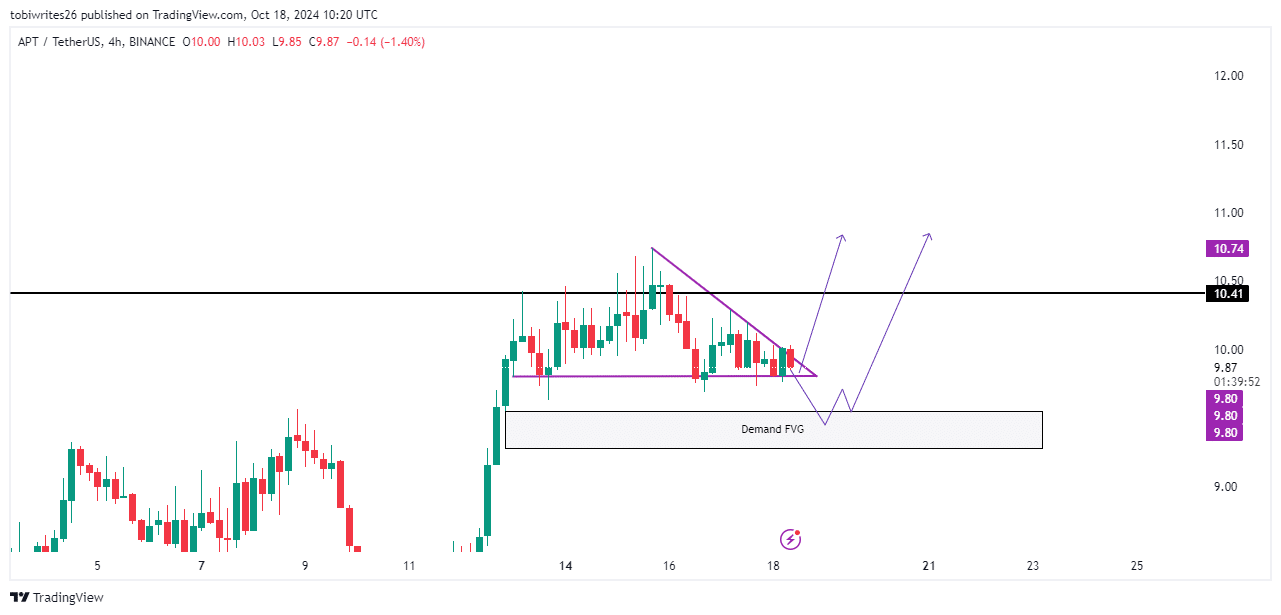
APT currently faces two potential outcomes—both leaning bullish, but taking different paths.
First, APT is trading within a bullish pattern, characterized by a horizontal support level and a diagonal resistance line. If this pattern holds, it could trigger a breakout beyond the key resistance at $10.41.
Alternatively, APT might fail to maintain this bullish structure, potentially dropping into a demand zone between $9.55 and $9.28. Strong buying interest in this zone could then push the price higher above the resistance.
AMBCrypto now assesses which of these scenarios is more likely to unfold as market conditions evolve.
Demand zone draws traders’ attention
APT is likely to drop into the previously mentioned demand zone, as trader activity suggests this outcome. Two key metrics from Coinglass—Open Interest and Liquidation data—support this view.
Open Interest has declined by 1.53%, dropping to $221.90 million. This indicates an increase in short positions relative to long ones, which has contributed to the downward pressure on APT’s price.
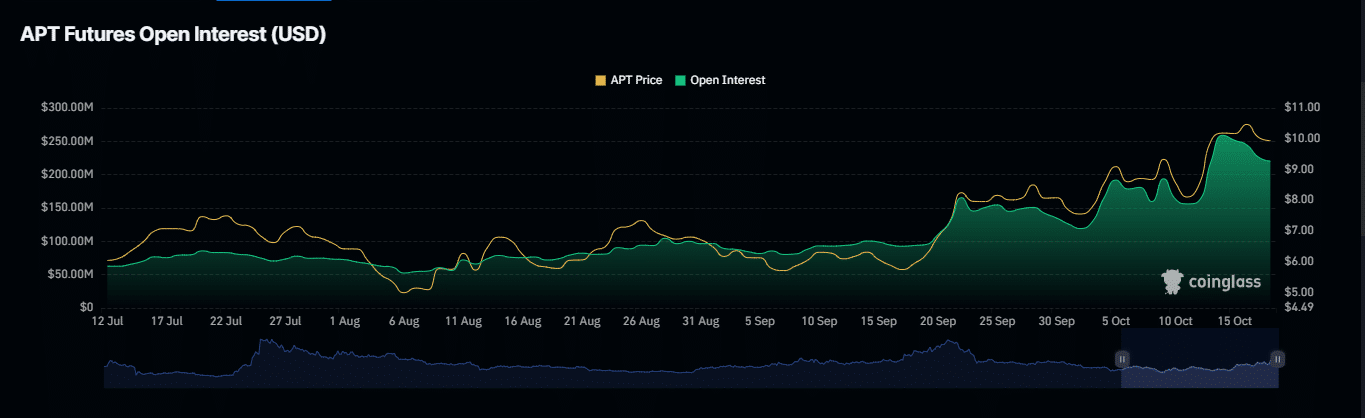
The market’s movement within the bullish pattern has also triggered $407.35 thousand of long liquidations. At this rate influences a downward trend which will further erode APT’s value.
With these metrics, among others, signaling a potential dip, APT seems to move lower into the demand zone.
Potential roadblock ahead for APT
The Relative Strength Index (RSI) has been tracking below a resistance line that has occasionally with APT’s movements closely mirroring these dips.
Read Aptos’ [APT] Price Prediction 2024–2025
If APT drops to the demand zone and then begins its anticipated bullish recovery, it will face this key resistance level. Failure to break through could halt the rally, delaying further upward momentum.
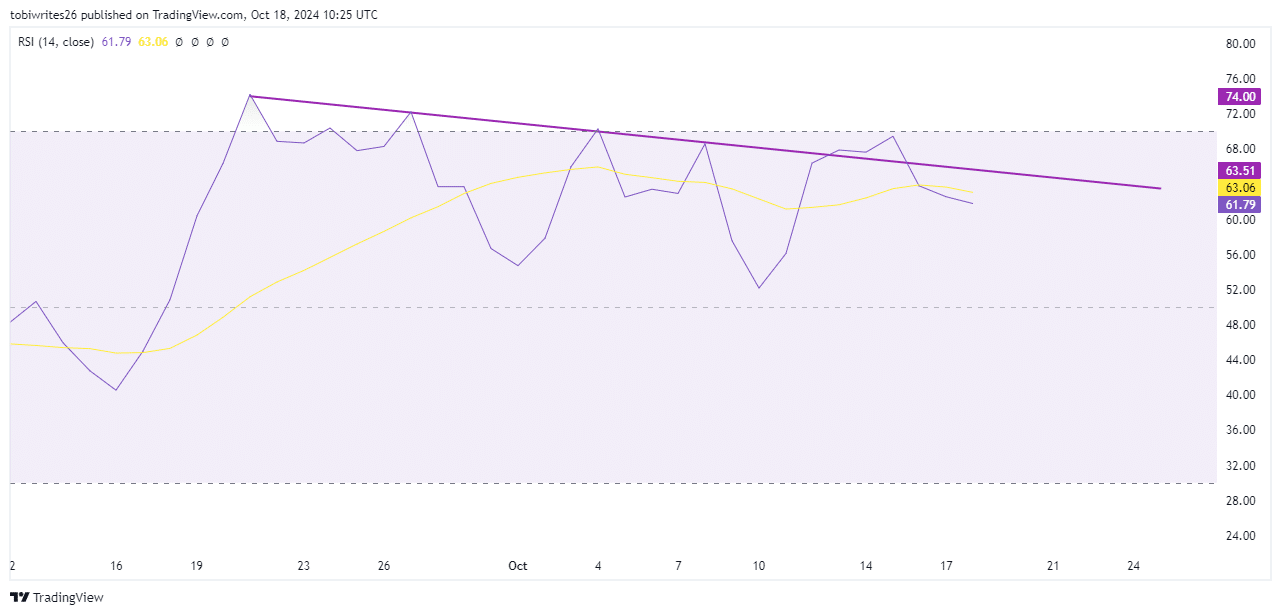
Although APT’s bullish outlook remains intact, its continued rise will depend on whether it can overcome this resistance.