
- Ethereum has faced rejection from the $2.7k resistance zone since August
- The climbing leverage ratio metric highlighted why a breakout might be unlikely
Ethereum [ETH], at press time, was trading within a range that reached from $2.8k to $2.2k. In particular, the $2.8k region has served as a steady supply zone since early August. It also has confluence with the 50% Fibonacci retracement level.
Examining the worrying price trends
The ETH/BTC chart has been trending south for just over 18 months. While Bitcoin [BTC] is trading 8% below its ATH, Ethereum is 46.3% away from its ATH. The altcoin’s performance must be looked at within the context of Vitalik Buterin’s vision for the next possible upgrade, “The Surge.” Especially some of its goals regarding transactions per second and maximizing interoperability between L2s.
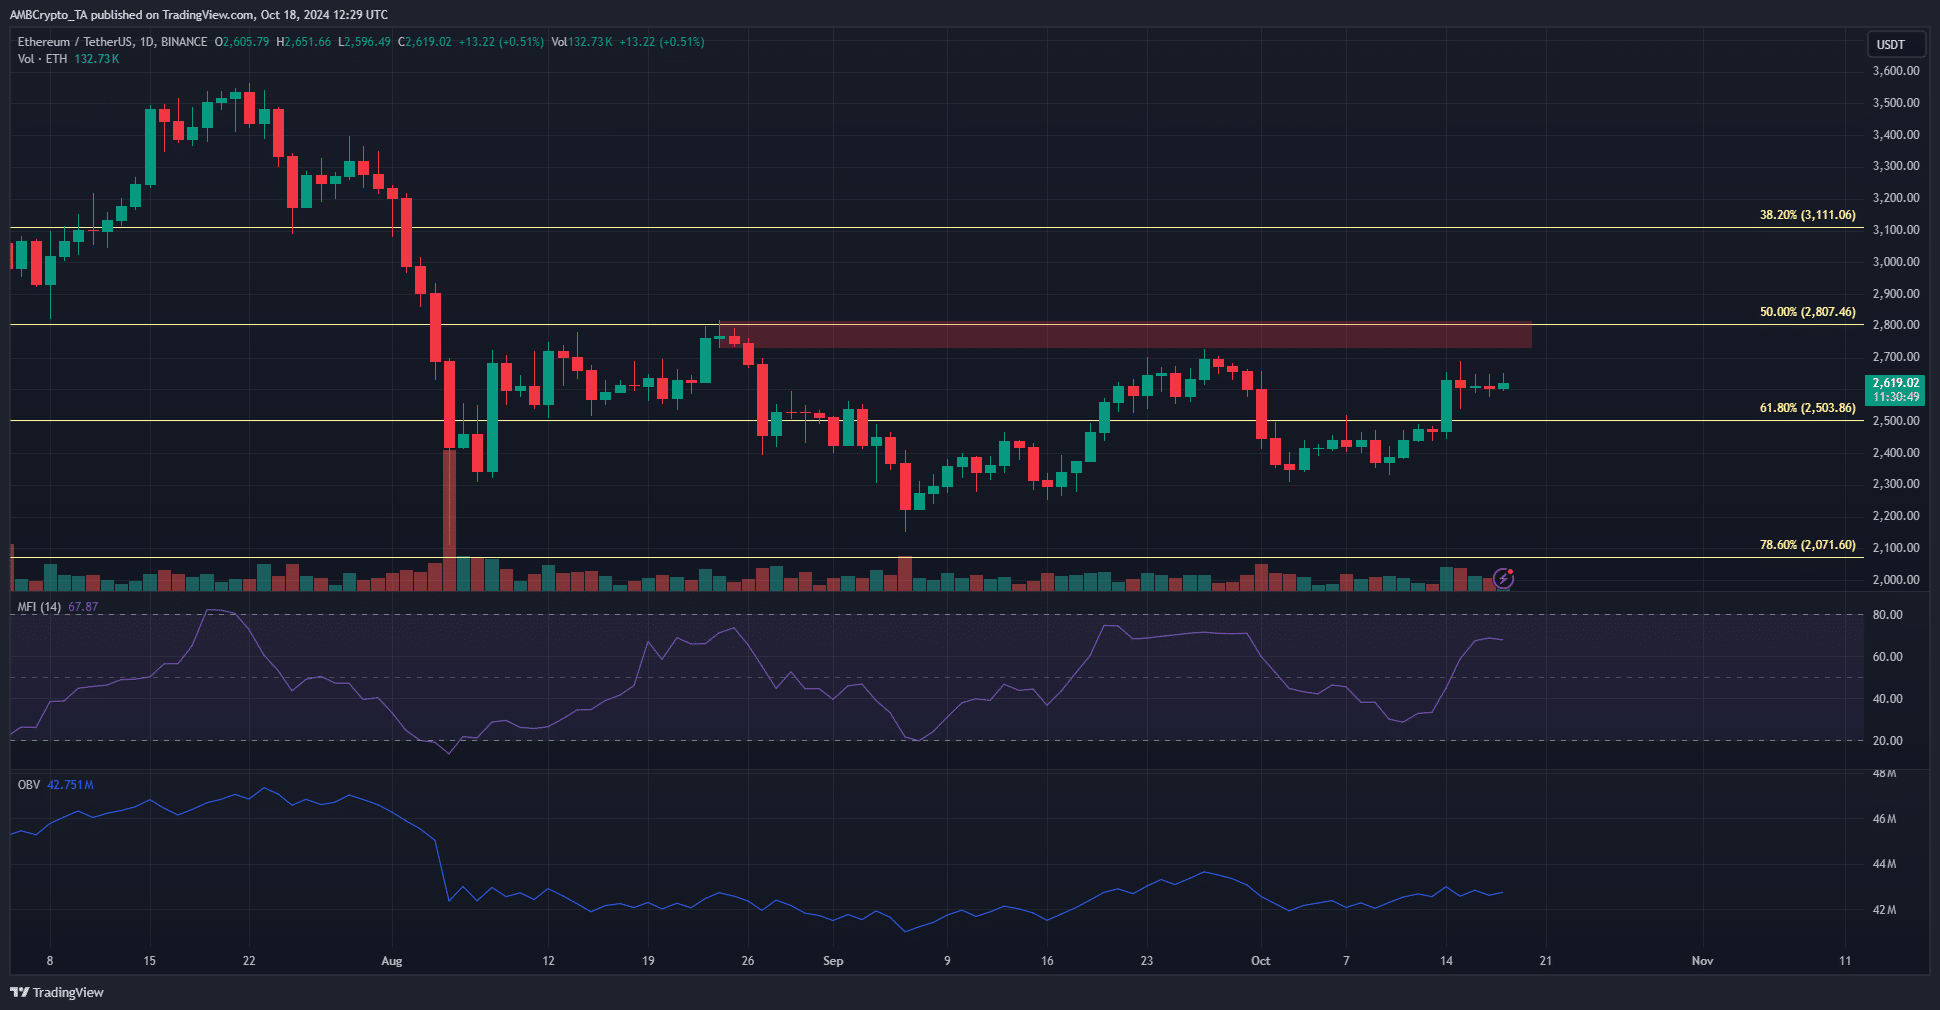
Source: ETH/USDT on TradingView
The performance of an asset is a clear insight into what the market believes the asset’s value is, and what it can be. Sometimes, hype and misinformation can skew these beliefs, leading to overvalued or undervalued assets.
The performance of Ethereum can be partly explained by inflationary concerns since the Dencun upgrade, but it is just a small part of the puzzle. The proposed improvements for the Proof of Stake system and the upgrades considered for the network at large could, when implemented, address network revenue, user growth, adoption, and other issues.
In turn, this could drive demand. As things stand, a rocky ride could be ahead for ETH on the price charts.
Clues from the derivatives market
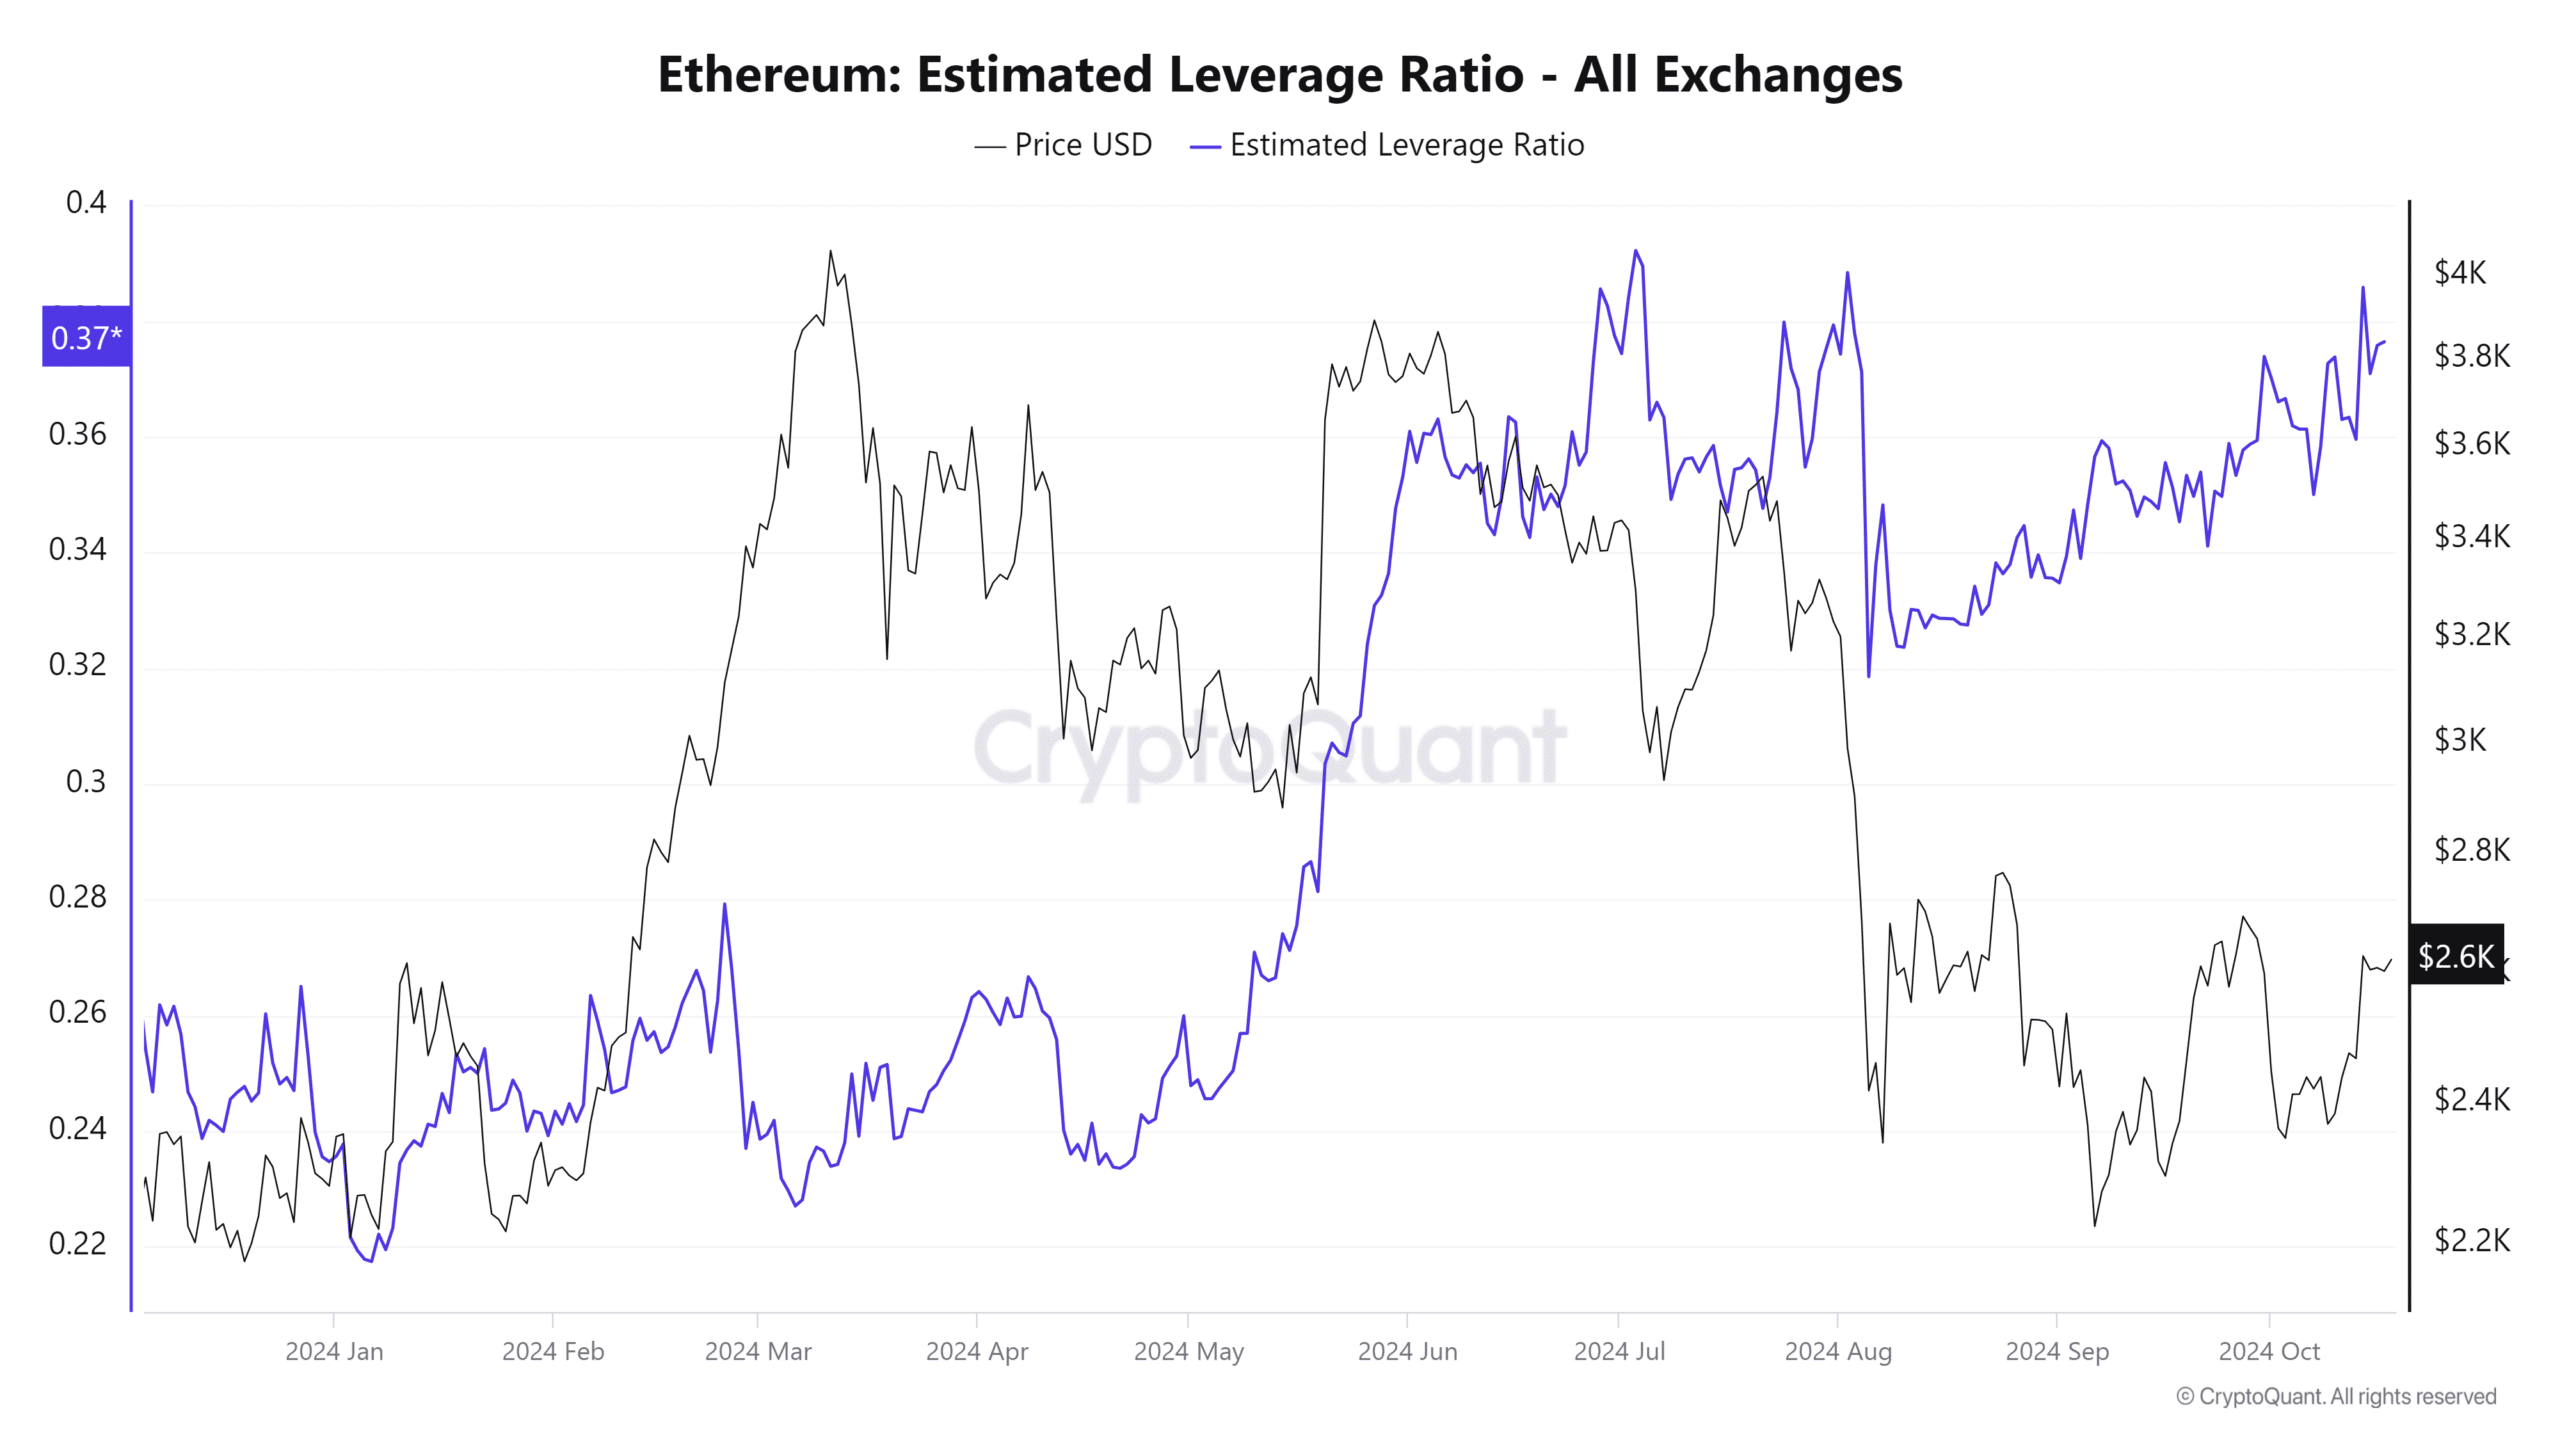
Source: CryptoQuant
The estimated leverage ratio (ELR) is calculated by dividing the Open Interest by the exchange’s coin reserves. Coinglass data also revealed that Open Interest has risen from $10 billion to $13 billion for ETH since the second week of August.
This helped explain the rising ELR. However, with the price trading beneath a key resistance, it can be interpreted as a warning sign for traders.
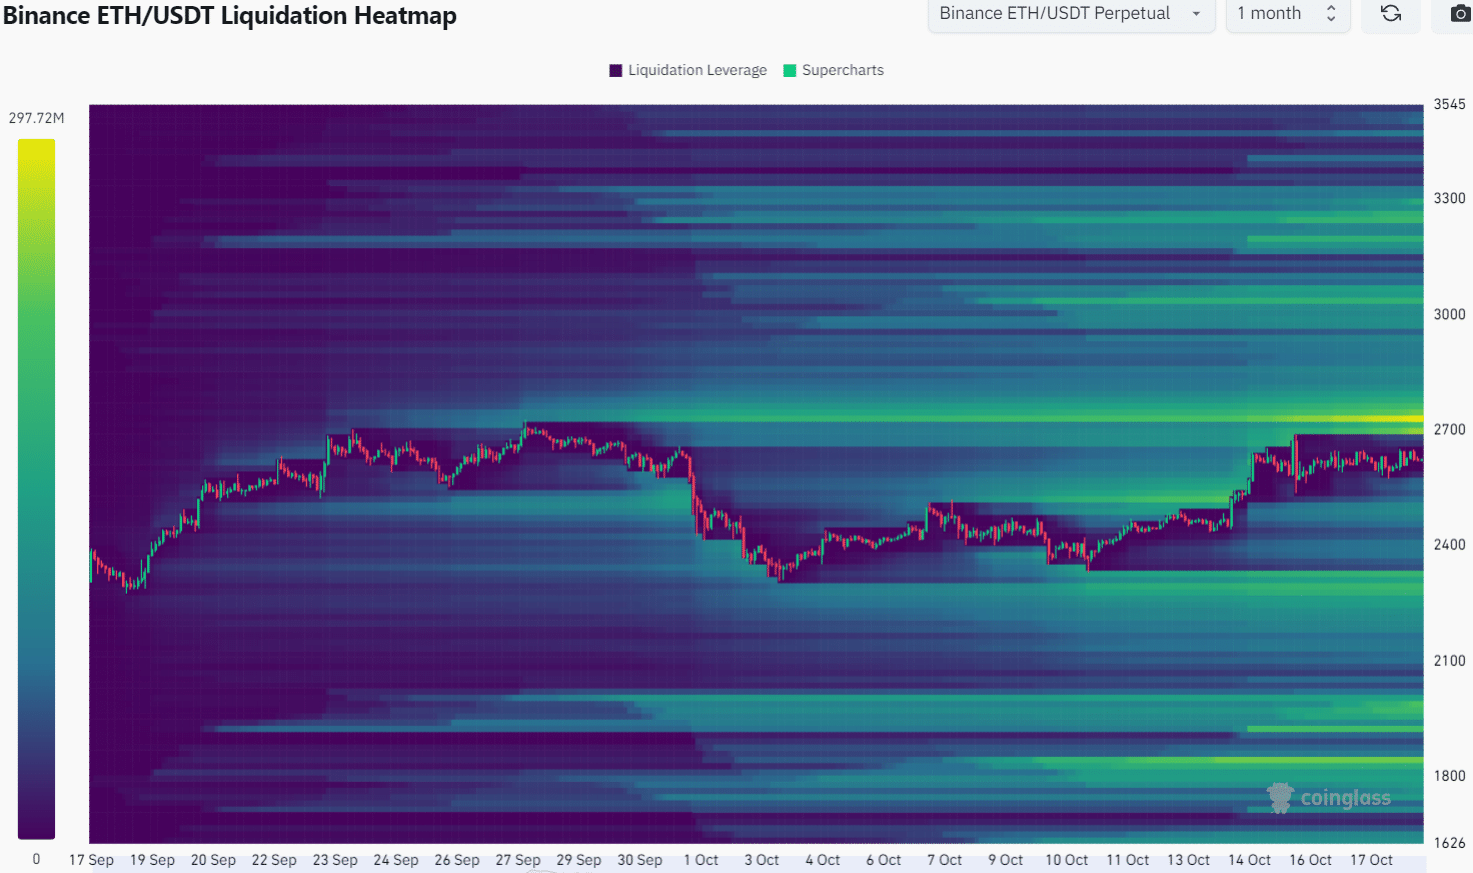
Source: Coinglass
The liquidation heatmap with a 1-month lookback period noted that the $2,730 zone is cluttered with liquidation levels. The 3-month chart showed that the $2,730-$2,850 area is important.
Together with the price action, we can see that a bearish reversal from these levels is a likelihood that traders must be prepared for.
Read Ethereum’s [ETH] Price Prediction 2024-25
Overall, the lack of organic demand and L2s capturing more participants and transaction activity remains a problem for the mainnet and its investors. Technical analysis gave clues that ETH bulls might lack the strength to drive the crypto’s price beyond $2.9k too.