Breaking down Ethereum’s price slump: Temporary setback for ETH?
ETH is expected to decline further in the short term, according to current market indicators.

- The recent drop in ETH’s price appeared to be a retracement.
- Market sentiment indicated a likely pullback, driven by weakening buying pressure.
Over the past 24 hours, Ethereum [ETH] has entered what is known as a retracement—a temporary dip that often precedes a renewed rally in bullish markets—resulting in a 2.70% decline during this period.
AMBCrypto reports that the downturn could extend further, potentially reversing the 1.62% gain ETH recorded over the past week.
ETH faces continued weakness
The ETH chart currently lacks bullish signals, indicating a potential further decline as it searches for an optimal level of liquidity to support a price increase.
At present, the nearest liquidity zone is the demand area spanning between $2,536.47 and $2,484.44. If the price enters this region, it could enable ETH to rally back to $2,820.92, which serves as a key target.
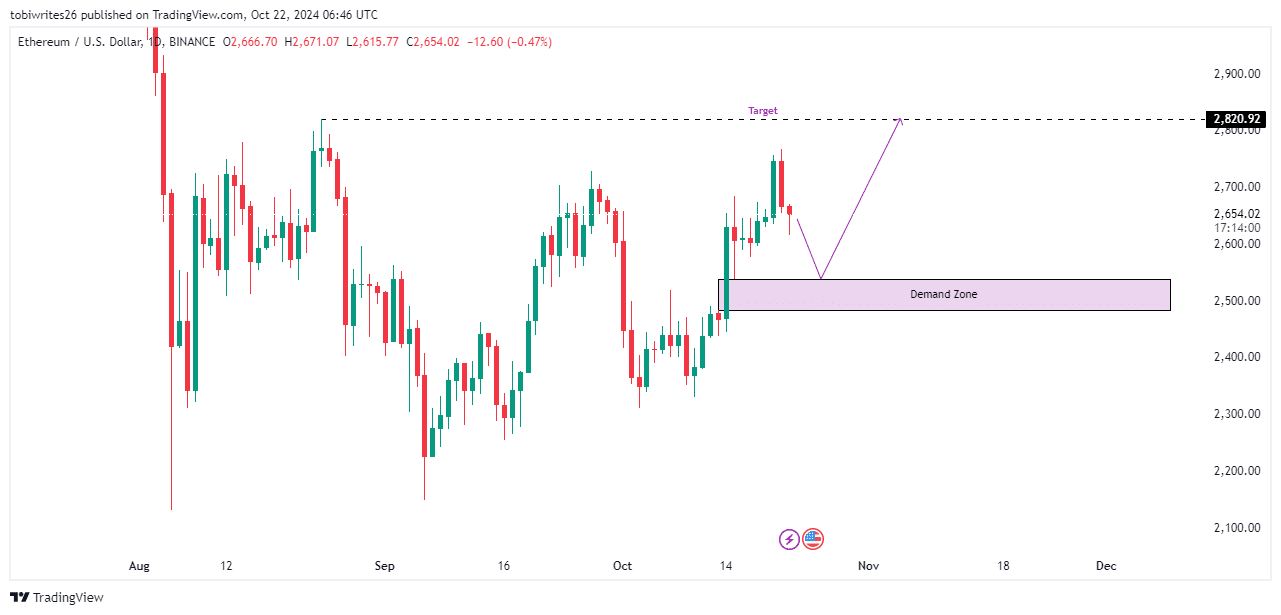
However, if ETH falls below this demand zone, it may trigger a stop hunt—a tactic where traders seek additional liquidity before making a final upward push.
Prolonged downward movement would suggest that ETH has entered a bearish trend.
Traders seek momentum in ETH market
Recent trading activity indicates that the market is seeking momentum, suggesting a potential decline from its current price of $2,654.02.
The Relative Strength Index (RSI) operates on a scale from 0 to 100, with 50 representing the neutral point. Readings above 50 signify positive momentum, while values between 50 and 60 indicate moderate buying pressure.
Conversely, readings below 50 reflect selling pressure, with a range of 30 to 50 signaling moderate selling. Values exceeding 70 indicate overbought conditions, while those below 30 suggest oversold conditions.
Currently, ETH has an RSI reading of 58.15, but it is trending downward, indicating that the price may decline as it seeks a demand zone, even though it remains actively bullish.
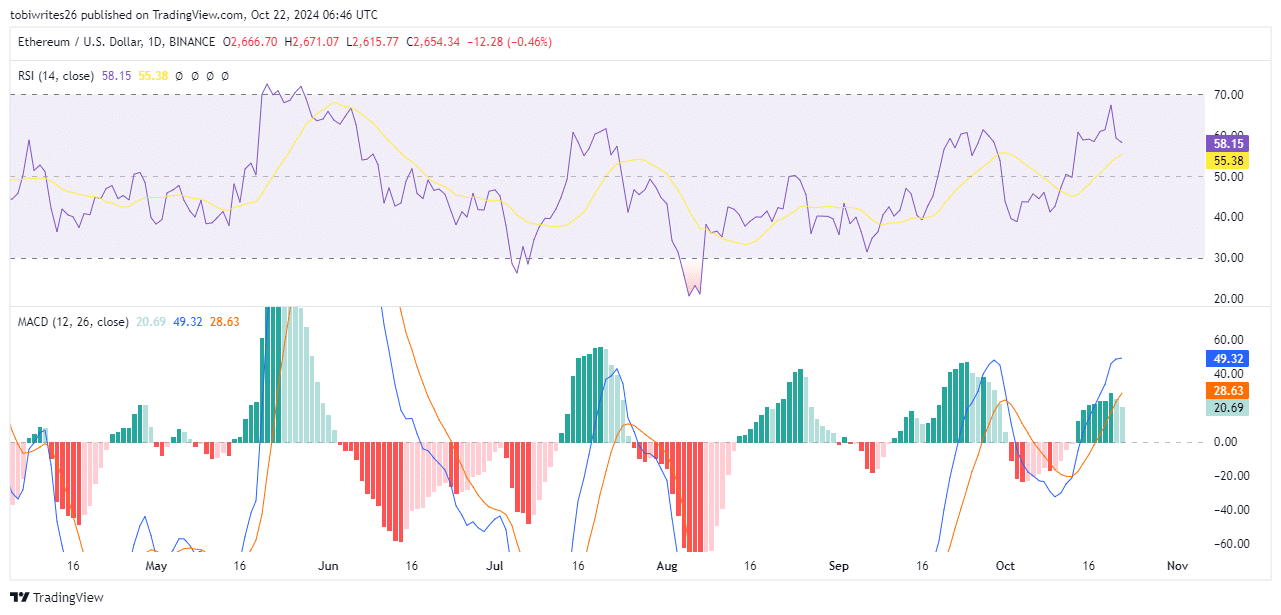
Similarly, the MACD, which remains in positive territory, has also shown a notable decline in momentum, as indicated by the fading green bars on the chart.
This suggests that while the overall market health is good, buying pressure is gradually diminishing.
Temporary retreat from sellers
Open Interest, an indicator used to assess trader sentiment in the current market, reveals that traders are predominantly positioning themselves to short the asset.
Read Ethereum’s [ETH] Price Prediction 2024–2025
According to Coinglass, Open Interest has declined to $13.56 billion, reflecting a 2.89% decrease.
If this trend continues, it suggests that selling pressure may drive the asset lower, although it could still maintain a bullish trend.