Uniswap surges 38% in a week over rising demand: A detailed look at what’s next

- Uniswap has heavy buying pressure driving its price rally.
- The price was at five-month highs and is likely to climb even higher.
Uniswap [UNI] reached highs not seen in nearly five months. The swift 17.46% surge from $9.16 to $10.76 occurred within an hour on Tuesday, the 12th of November, just a few hours before press time.
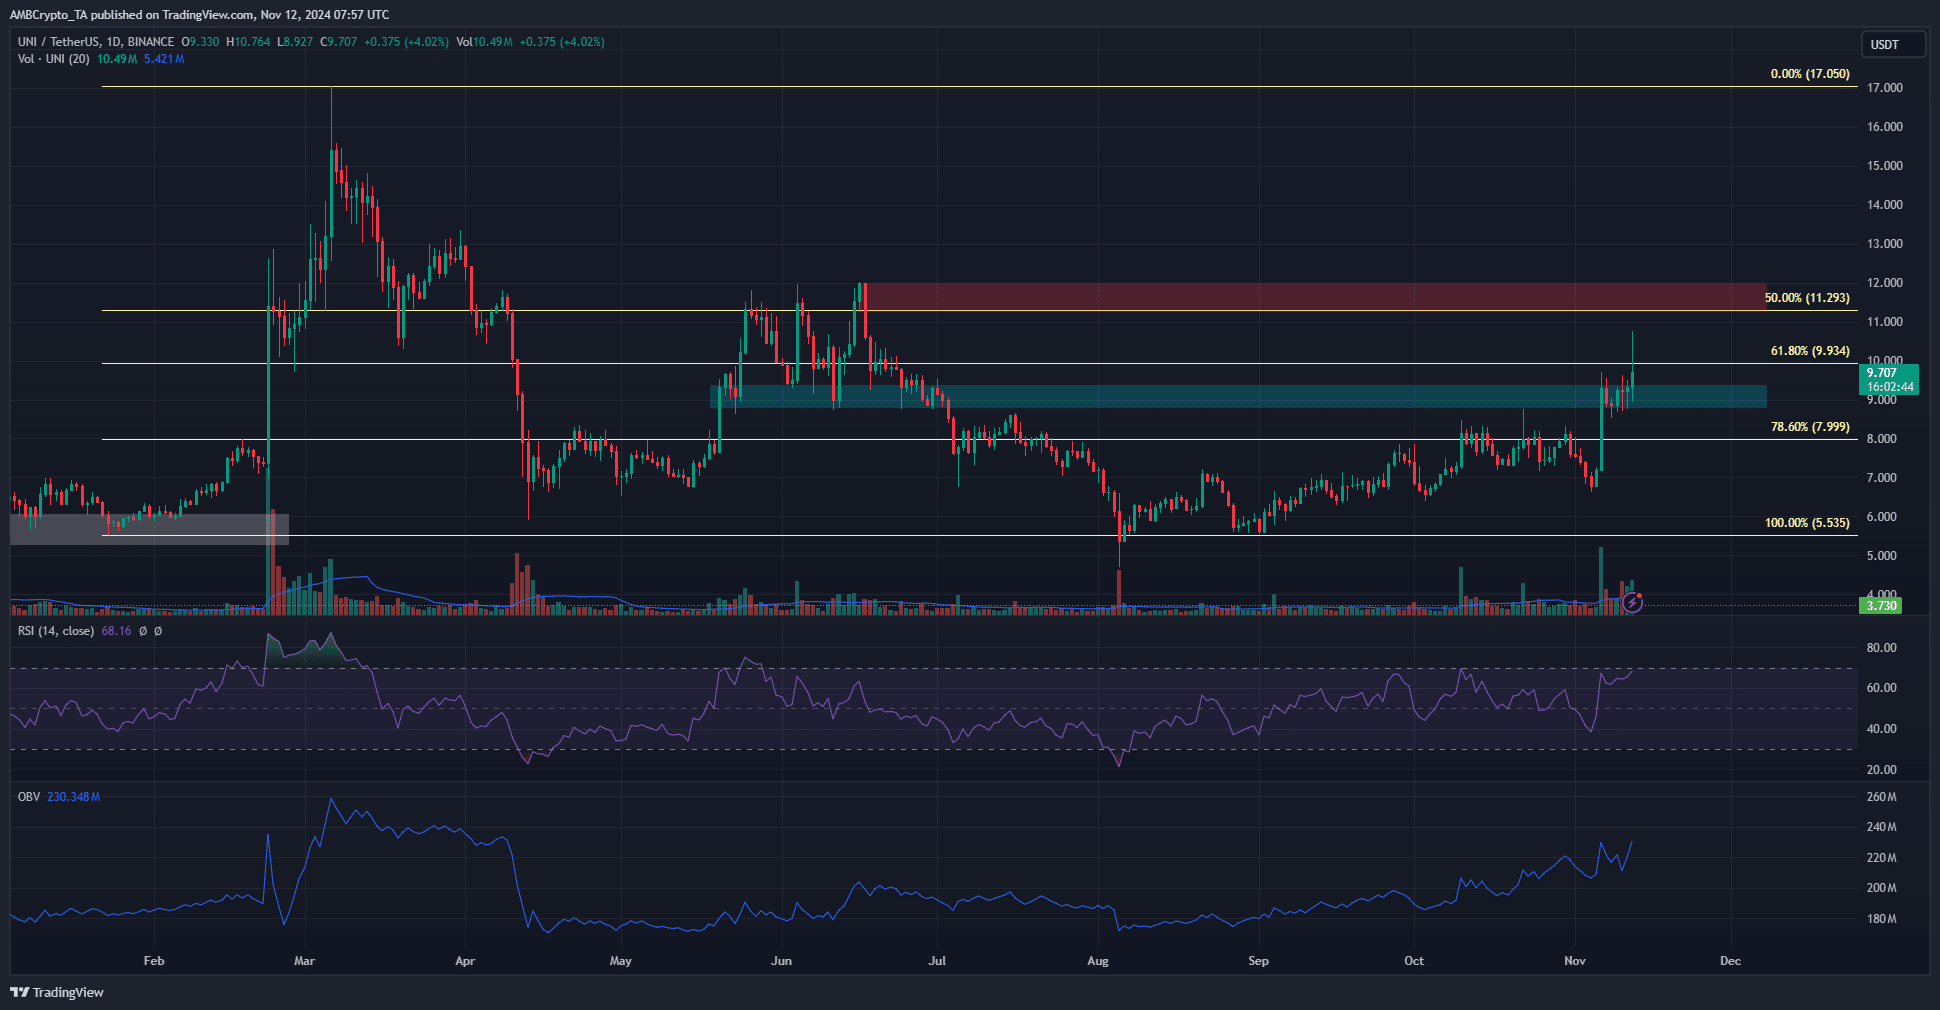
In September and October, UNI kept below the $8 resistance level. This changed dramatically on the 6th of November, and the $9 region was almost flipped to support back then. After a few days of consolidation, the bulls were driving prices higher once more.
Uniswap reclaims $9 zone as support
The bulls were unable to hold on to the $10 level after the short-term surge. On the daily chart, it remains likely that the uptrend will continue. The market structure was bullish, and the OBV was also forming higher lows to reflect steady buying pressure.
The RSI was at 68 but a bearish divergence was not yet formed. This meant that Uniswap was likely to climb higher.
The Fibonacci retracement levels showed that the $9.93 and $11.29 are the next resistances. The performance of UNI on the higher timeframes was not ideal, having retraced 100% of the February rally by August.
Should traders expect a dip to $9 soon?

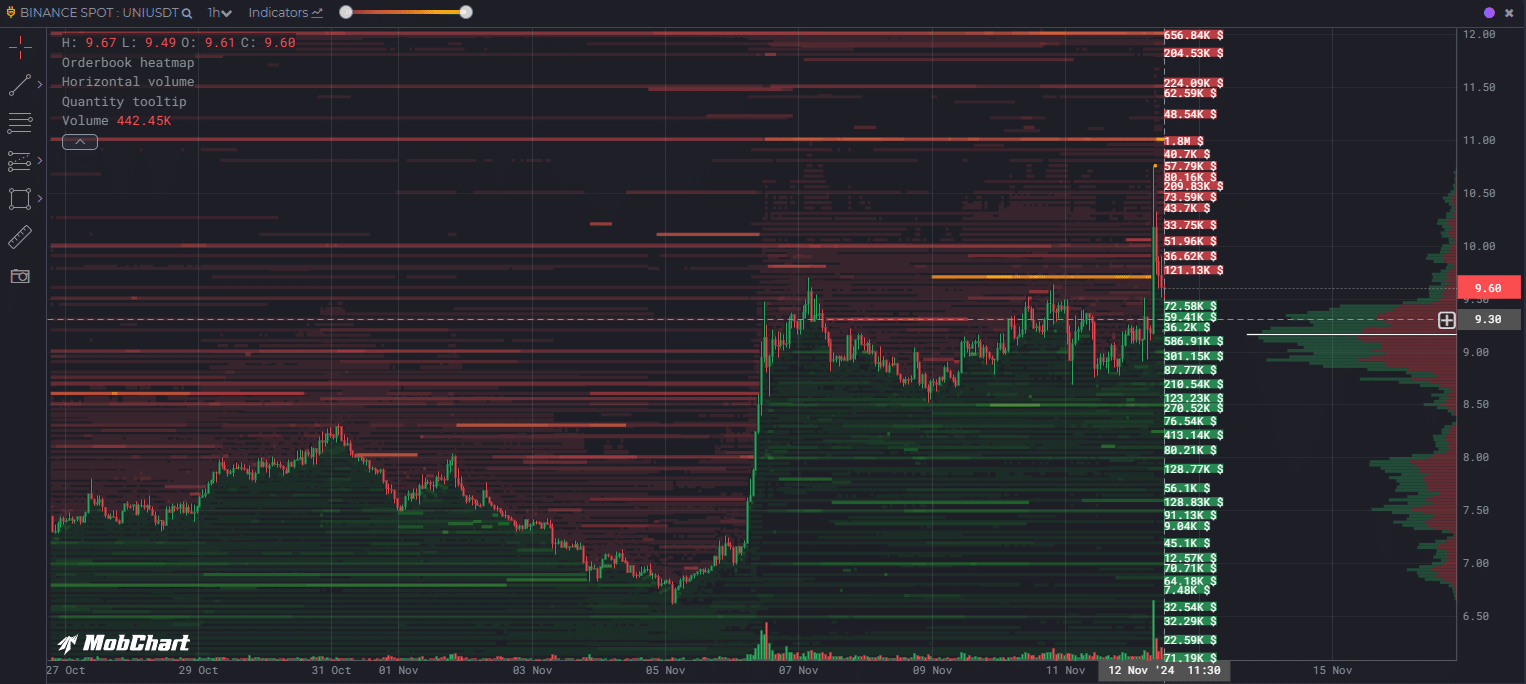
Source: MobChart
Data from MobChart showed that the $11 and $12 levels had large limit sell orders. At the same time, the limit buy orders at $9.2 and $9 were of interest and could be retested before the next move higher.
Realistic or not, here’s UNI’s market cap in BTC’s terms
From the Uniswap daily price action chart, the breakout past the 78.6% level at $8 was a sign of bullish conviction. The $11-$12 region is likely to be tested in the coming weeks.
Disclaimer: The information presented does not constitute financial, investment, trading, or other types of advice and is solely the writer’s opinion


