XRP price prediction: Why the $0.7 rejection isn’t a setback for bulls

- XRP failed to break out past the near 16-month range formation.
- The $0.62-$0.65 is expected to act as a support zone.
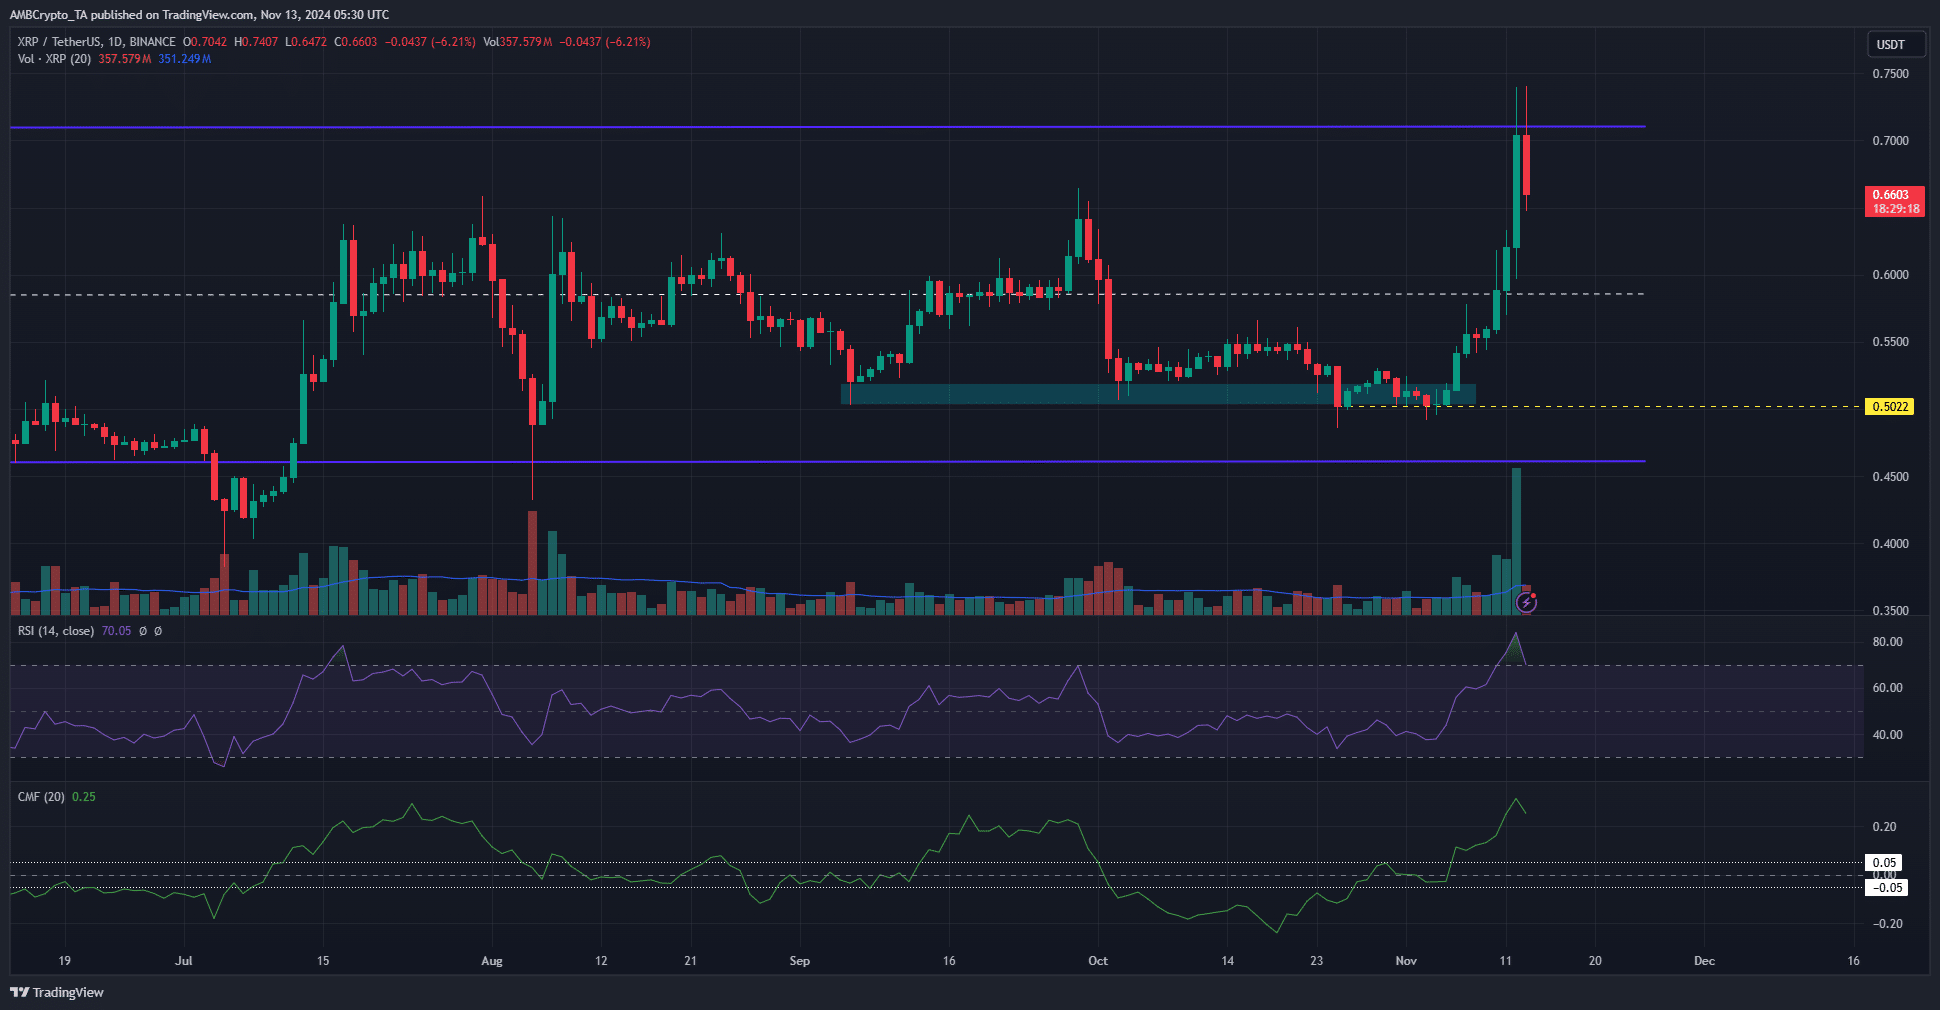
Ripple [XRP] rallied by 49.2% from $0.496 on Monday, the 4th of November, to the high of $0.74 on Tuesday, the 12th of November. A symmetrical triangle and an impending breakout predicted in an earlier AMBCrypto report have come to pass.
At press time, the former local highs at $0.62-$0.644 were being tested by the altcoin as a support zone. It has been defended so far, but the rejection from $0.7 must sting. Can the bulls push higher?
XRP price prediction: Indicators remain firmly bullish
The 1-day market structure was bullish after the $0.566 lower high from the 17th of October was broken on the 10th of November. As noted earlier, the local highs around $0.65, set from July to September, are expected to act as a demand zone.
The RSI was at 70 despite the rejection from $0.74, showing intense bullish momentum was prevalent on the daily chart. The CMF was at +0.25 to signal high capital inflows to the market and hefty demand driving to attempted range breakout.
The trading volume during the move beyond $0.65 was encouraging as well. Therefore, it is likely that the $0.62 retest would present a buying opportunity.
Short-term sentiment beginning to cool
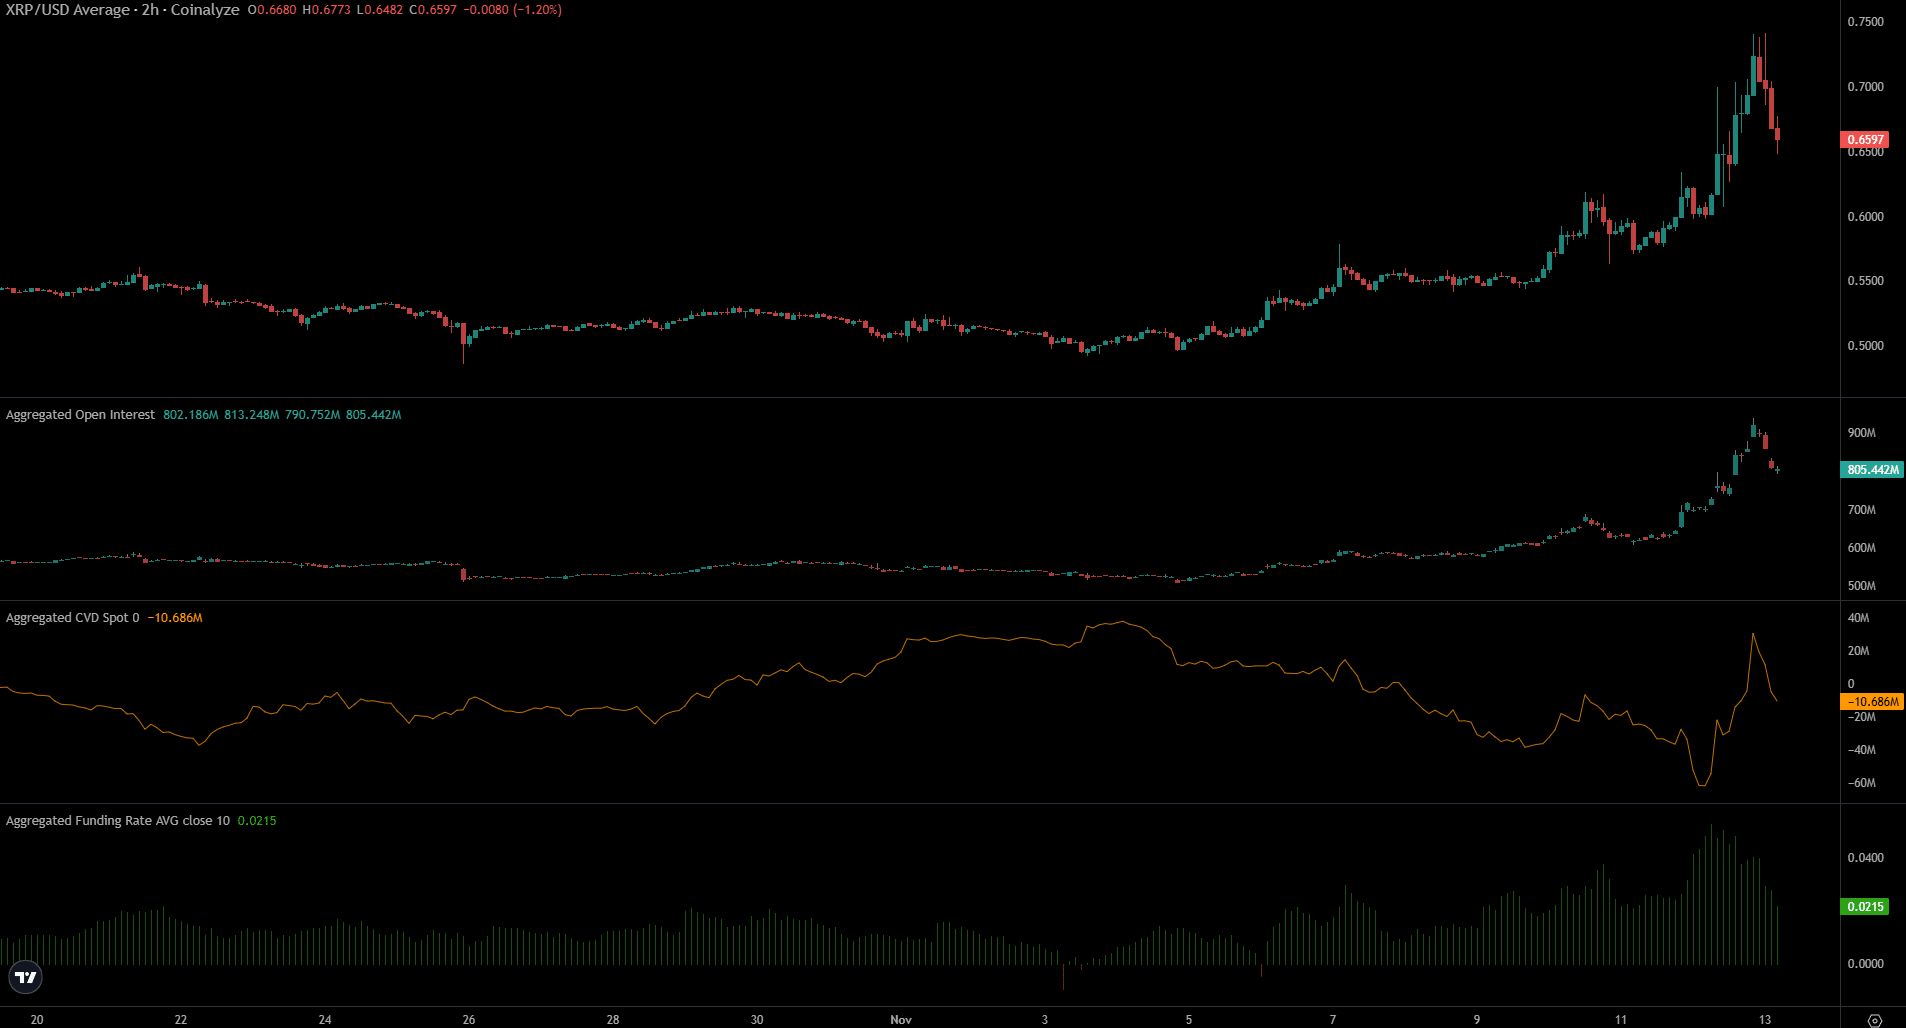
The funding rate formed a local high around +0.04 while the Open Interest soared to $933 million, indicating heavy bullishness from speculators. The spot CVT, which had been in a slump this month, recovered and pushed higher.
The funding rate has begun to recede, as did the OI. Together, they showed that bullish sentiment was slowing down, and XRP might consolidate before its next impulse move.
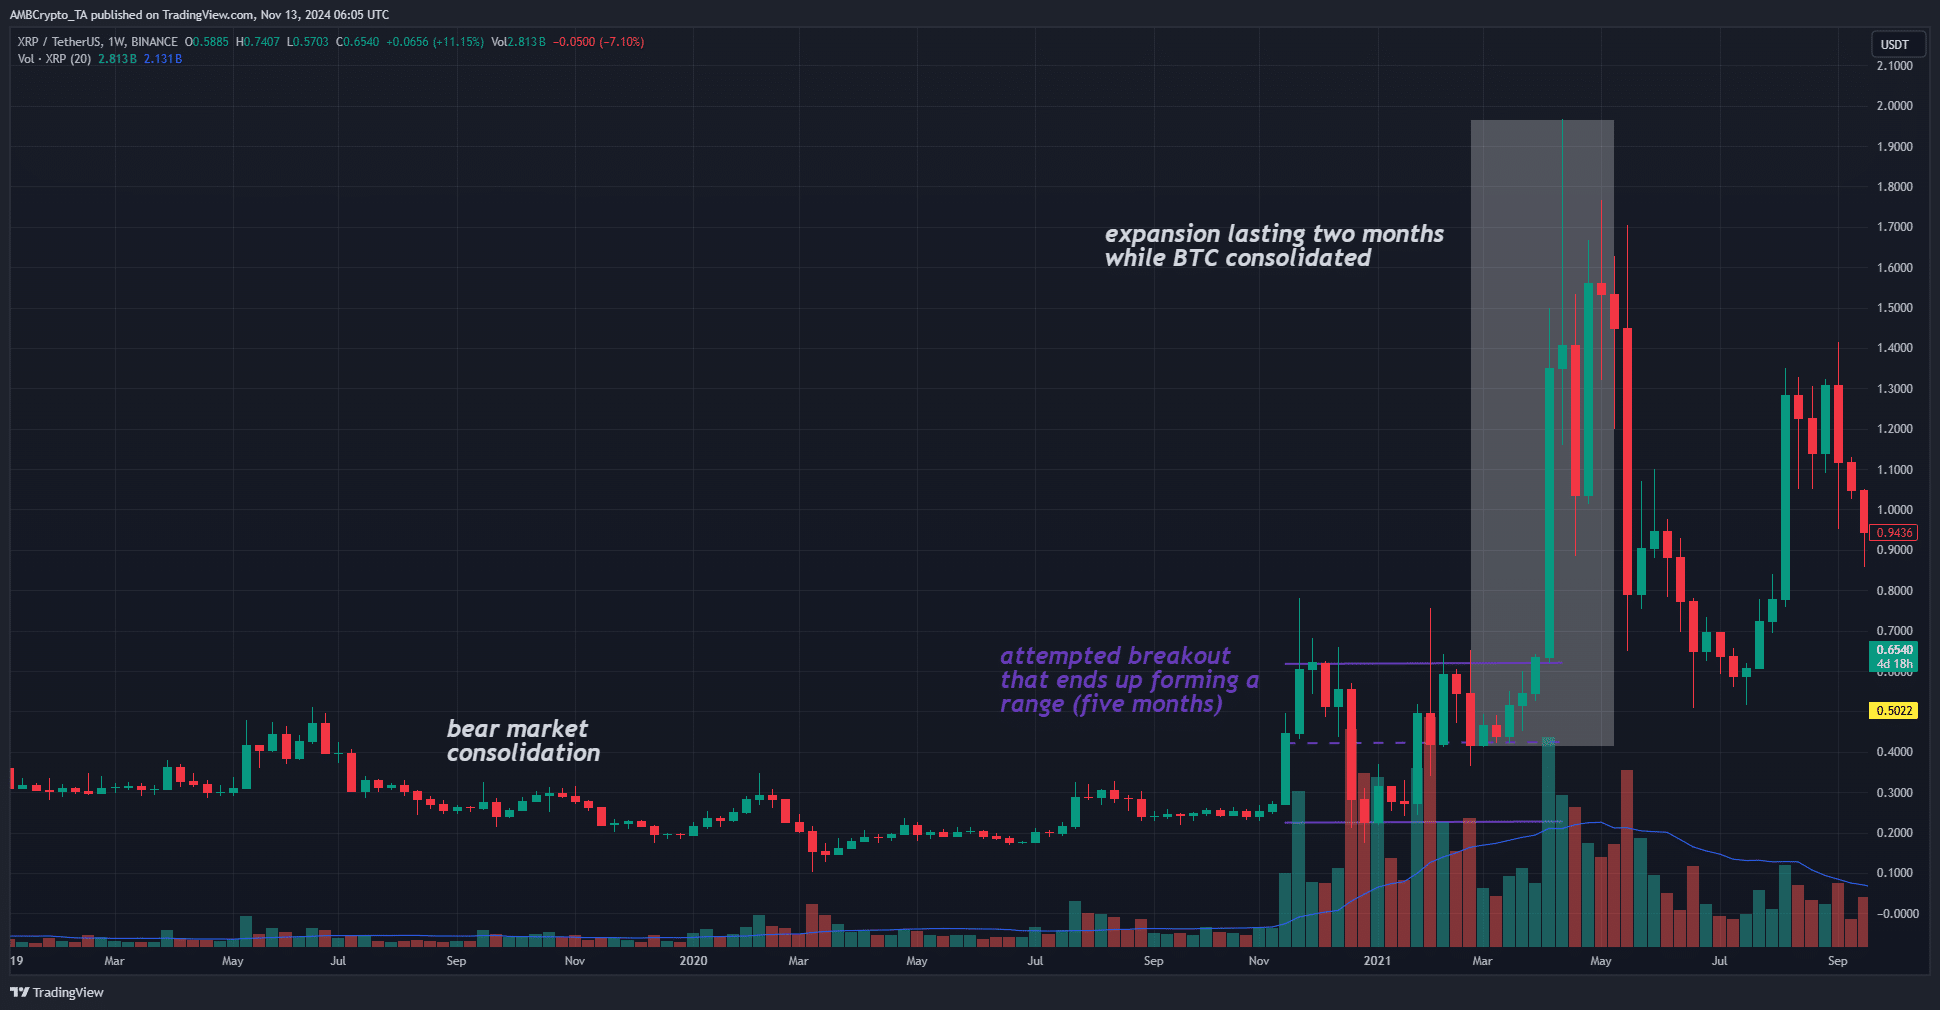
In 2019 and up to November 2020, XRP consolidated around the $0.3 mark. It saw a test pump to $0.78 toward the end of November, forming a wide range between $0.23 and $0.62.
This was followed by a 217% rally beyond the range highs once Bitcoin [BTC] began to consolidate around $60k in April 2021.
Read Ripple’s [XRP] Price Prediction 2024-25
A similar scenario could occur during this cycle. The aggressive expansion that forms a range occurred in July 2023, and XRP bulls still haven’t broken out beyond it.
Once the $0.7-$0.8 region is reclaimed as support, XRP holders would likely experience large profits. This could take months, and would need Bitcoin to consolidate near its highs- ushing in the altcoin season.
Disclaimer: The information presented does not constitute financial, investment, trading, or other types of advice and is solely the writer’s opinion


