Can Litecoin buyers sustain altcoin’s price uptrend? It will depend on…

- Litecoin’s price action is at a crucial stage right now, oscillating in a broadening wedge pattern
- LTC’s derivatives data depicted a slight near-term edge for market bulls
Litecoin’s recent recovery has propelled the altcoin above key resistance levels and into a potential breakout zone on the charts.
At press time, LTC was trading at $78.55, up by 4.19% in the last 24 hours. The question now remains – Will buyers maintain momentum and test higher resistances, or are we set for a patterned breakdown?
Litecoin chalked out a bearish pattern on the daily chart
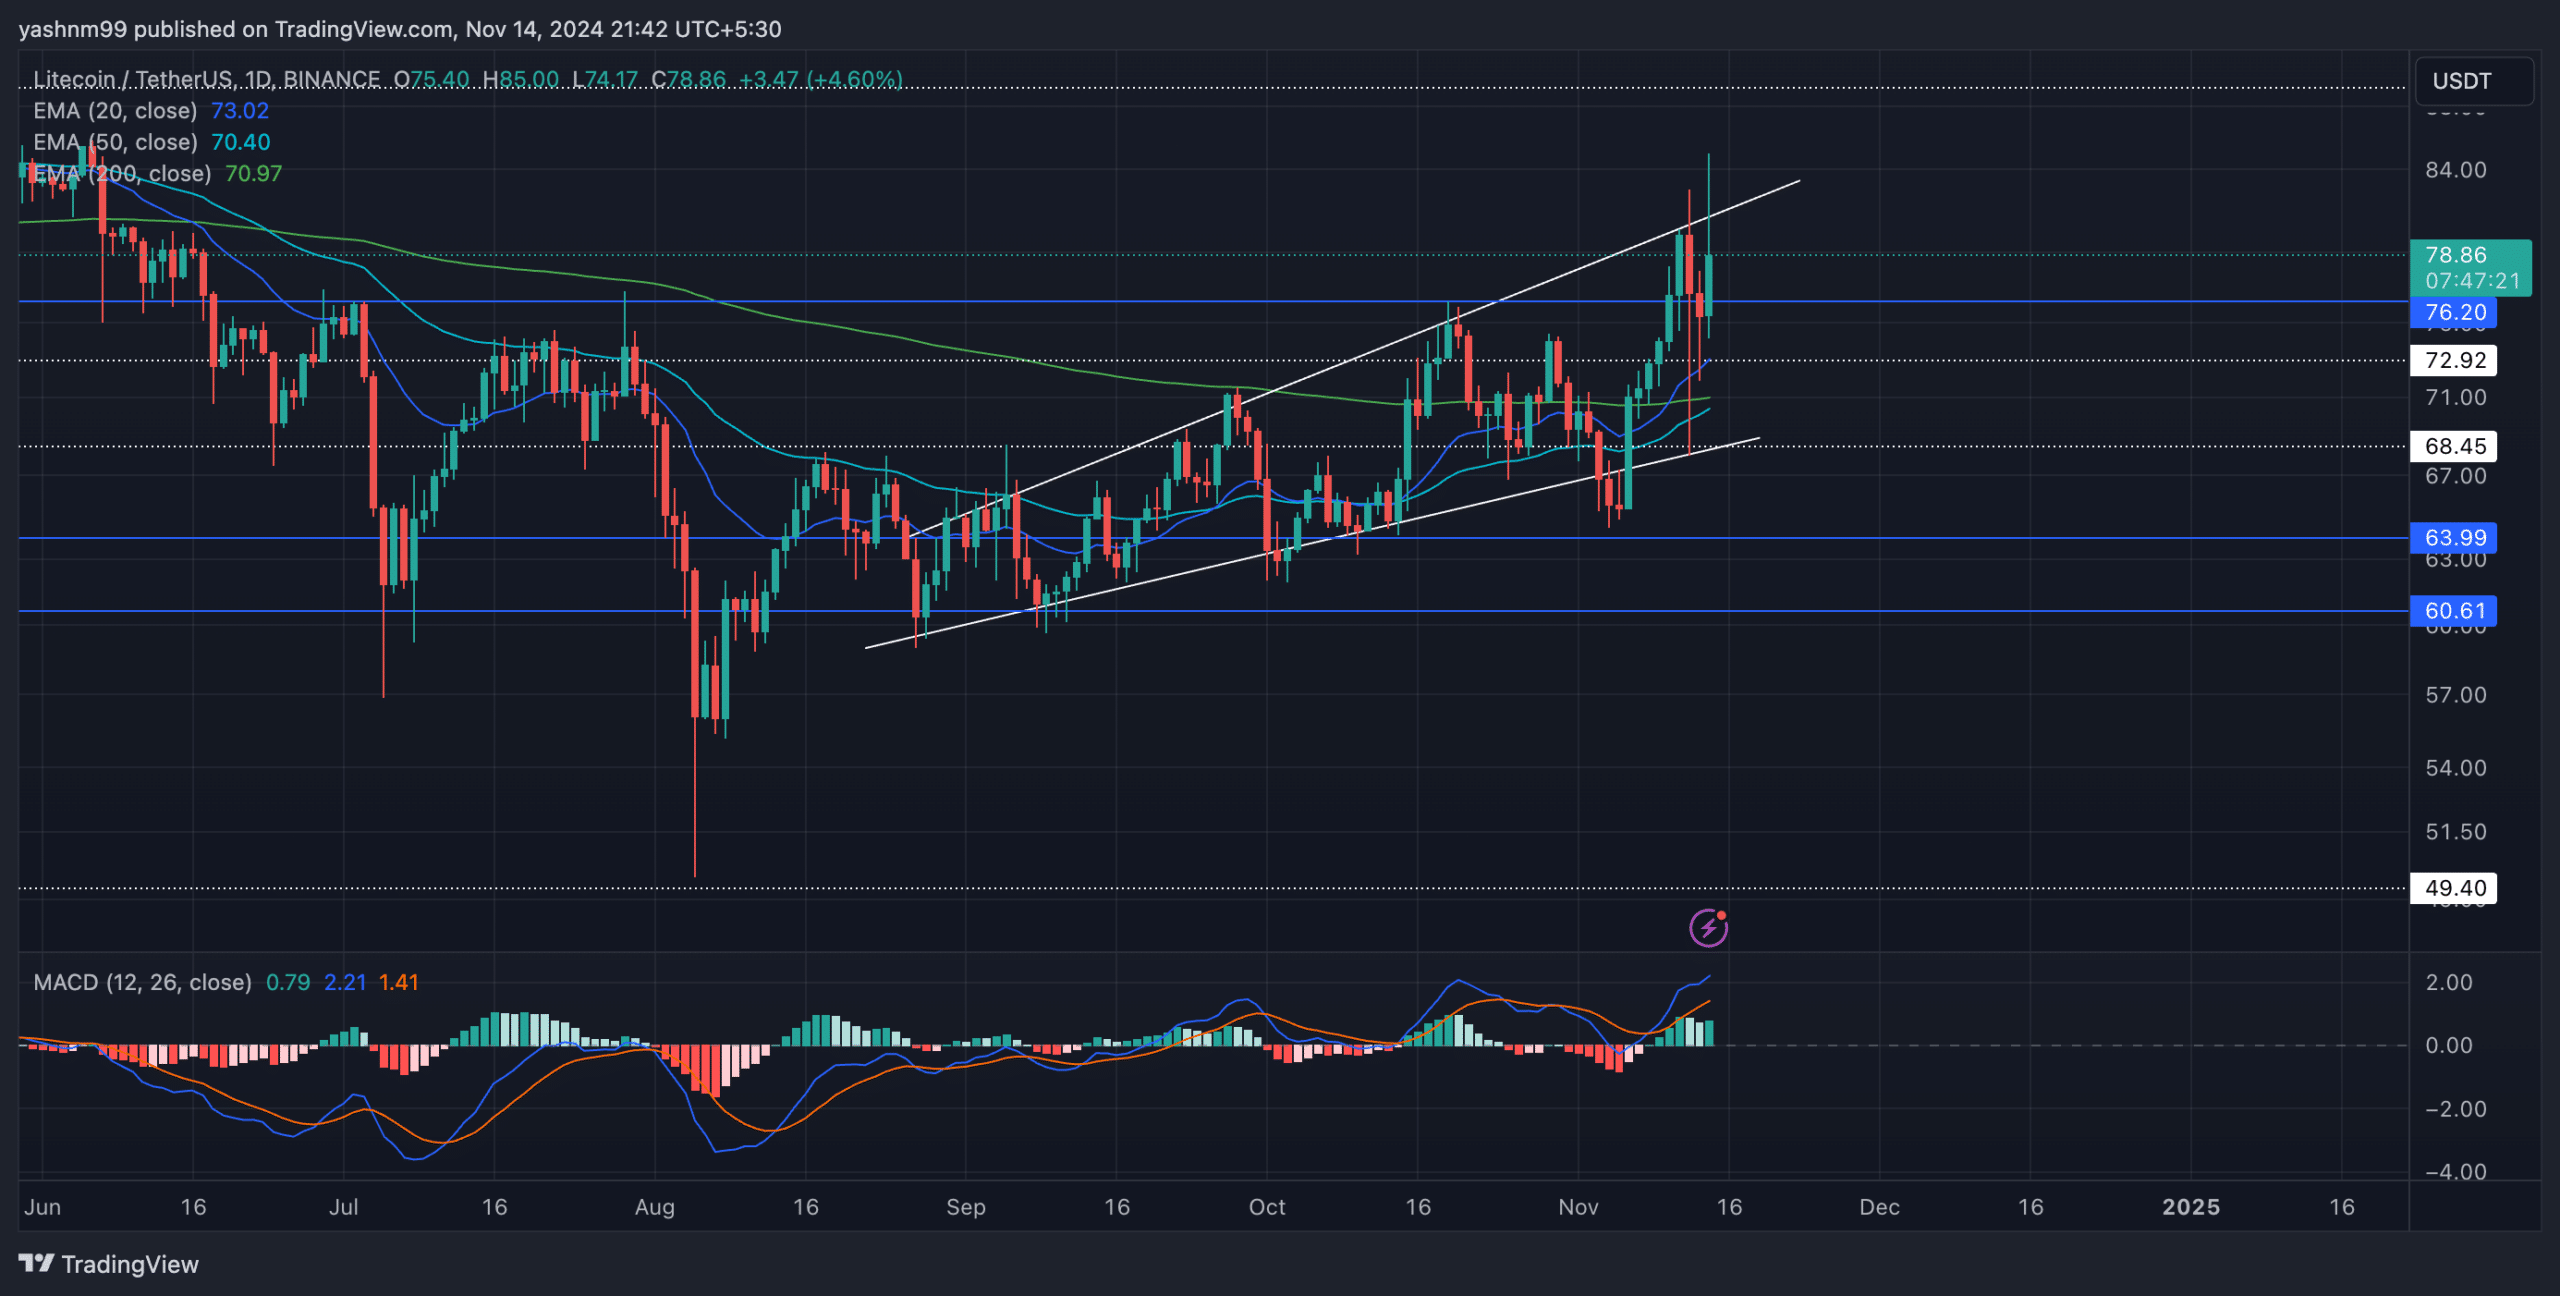
Litecoin’s price action has been trending within an ascending broadening wedge pattern for the last three months. This pattern (typically signifying indecision) has seen LTC navigating around its key moving averages and testing the boundaries of the wedge.
Recently, Litecoin moved above the 20-day, 50-day, and 200-day EMAs. At press time, LTC seemed to be at a critical juncture, with the price testing the upper boundary of the broadening wedge.
A successful break above this resistance could propel LTC towards its next major resistance at $89. However, should the price action reverse as per the pattern’s trajectory, a pullback towards the support level around $72 could be in play.
Any patterned breakout can potentially find support at $64 and $60.61. These levels could become crucial in defining the medium-term trend for the altcoin.
The MACD indicator underlined mixed sentiment. The MACD line was above the Signal line, showing a slight bullish bias. Both lines were also in positive territory, indicating that buying interest was still present. However, a potential reversal in the MACD lines or a dip below the zero line could mean a hike in selling pressure.
Litecoin derivatives analysis
The derivatives data offers a slightly positive outlook for LTC. Trading volume surged by 105.54%, hitting $1.29 billion. Additionally, Open Interest rose by 2.56%, indicating that new positions are being opened amid the recent price surge. This activity could imply that traders have been positioning themselves for a major market move, possibly indicating confidence in a continued uptrend.
The 24-hour long/short ratio was 0.9298, underlining a balanced sentiment among traders. However, on key platforms like Binance and OKX, the long/short ratios were more optimistic, at 2.2755 and 2.82, respectively. The top traders’ long/short ratio for LTC/USDT on Binance was at 2.5549, showing that many major traders have been expecting a further upside.
Traders should also pay attention to broader market movements, especially Bitcoin’s, as it will likely influence LTC’s direction. The ongoing momentum and positive derivatives data indicated that buyers might still have the potential to push higher. However, any patterned breakdown can provoke a short-term downtrend before an upside.


