MNT bulls plot a recovery – Can they overcome THESE hurdles?

- Mantle was unable to continue the uptrend it began earlier this month- showcasing a lack of conviction.
- It remains to be seen whether Mantle can outperform other popular large-cap altcoins, but there is some hope.
Mantle [MNT] saw a rapid 74% move from $0.541 to $0.94 which took just five days. It began on the 4th of November and reached local highs on the 9th of November, before facing a deep pullback.
During this period, many altcoins were making large gains. The retracement of MNT came at a time when Bitcoin [BTC] broke out past the $75k level. Further Bitcoin gains drew more attention to the king of crypto, leaving altcoins like Mantle waiting in the shadows.
Buying opportunity for Mantle bulls?

Source: Santiment
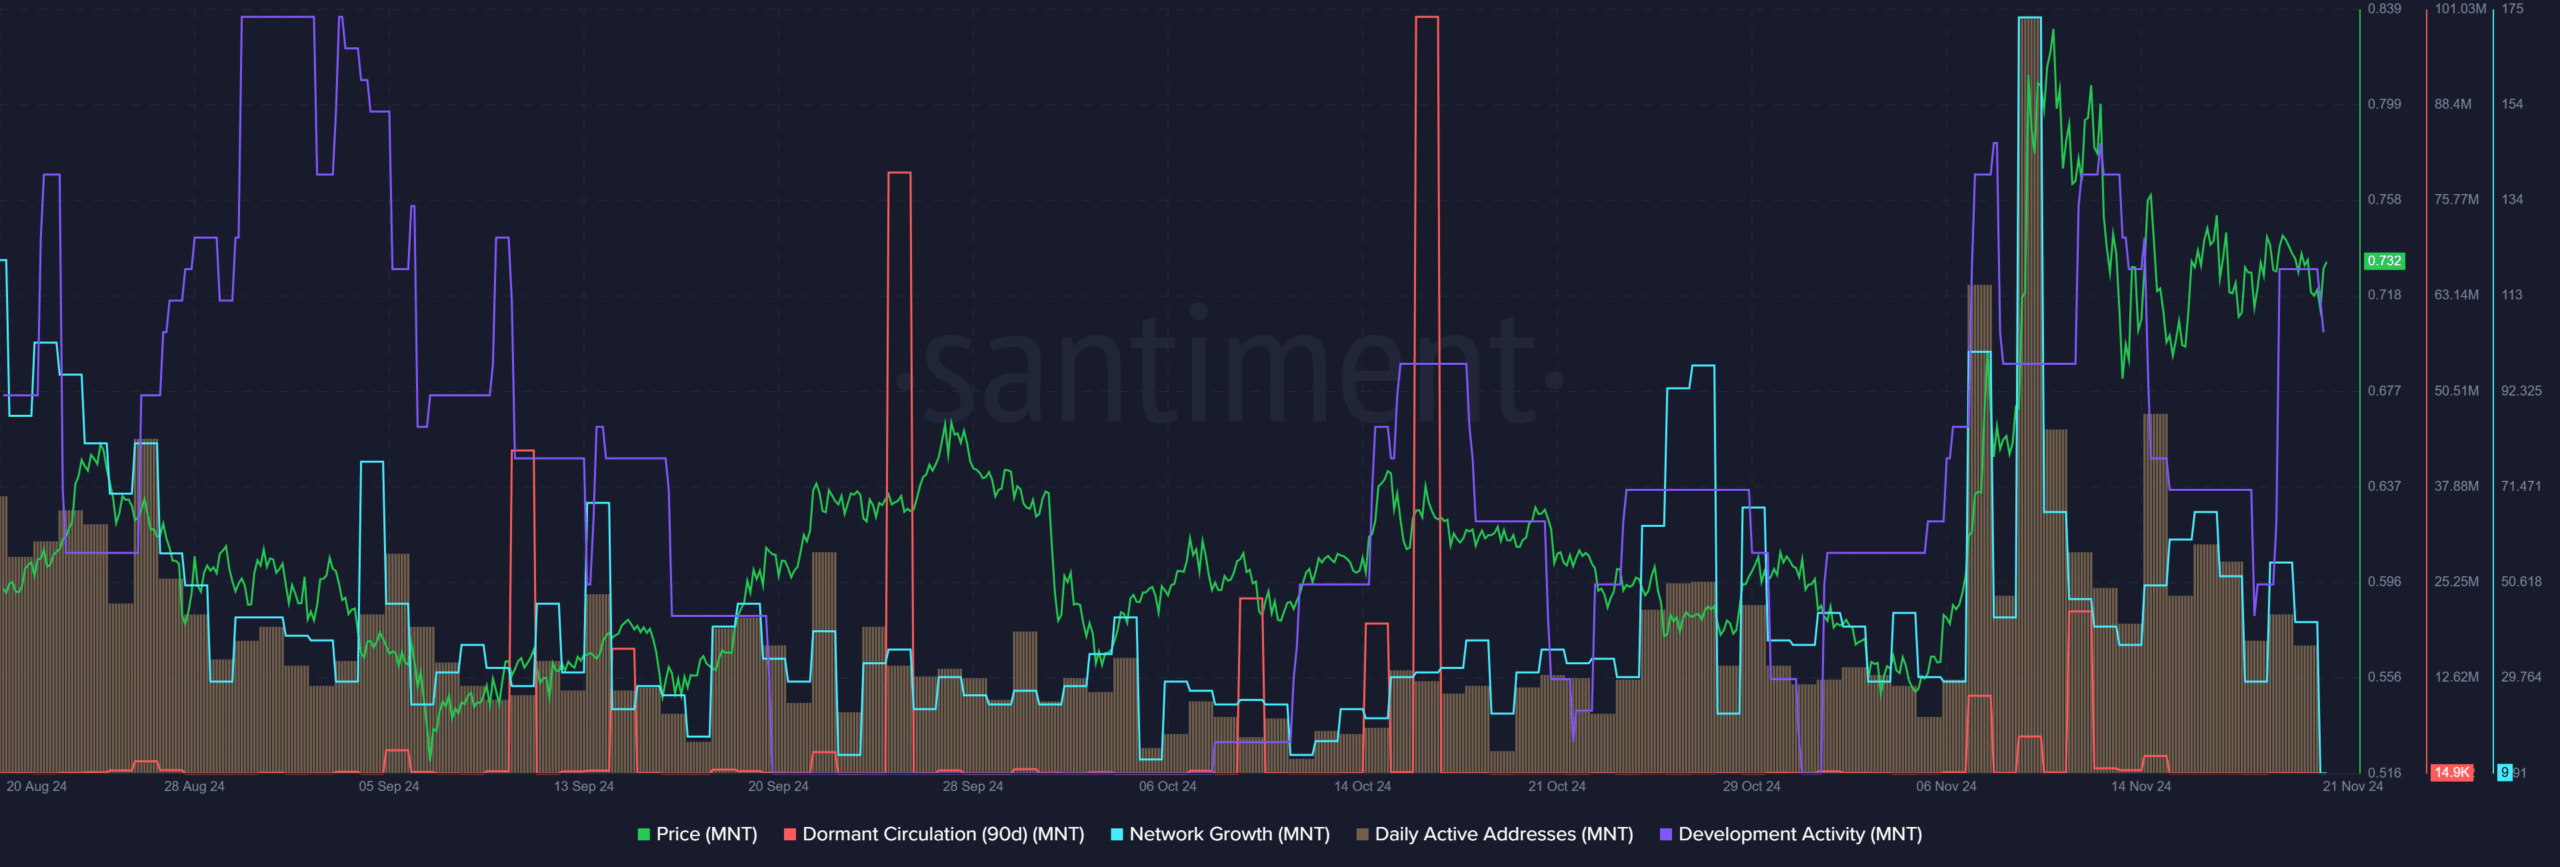
The rally beyond $0.9 saw the daily active addresses and network growth make 3-month highs. The previous time such high activity was seen was in mid-August when Mantle fell to the $0.6 range lows.
In the past week, the network activity has been in decline. This showcased decreased participation and demand for MNT. The dormant circulation was low, showing that high selling pressure was not imminent.
The development activity was also relatively high and should bolster long-term holders’ conviction.

Source: Santiment
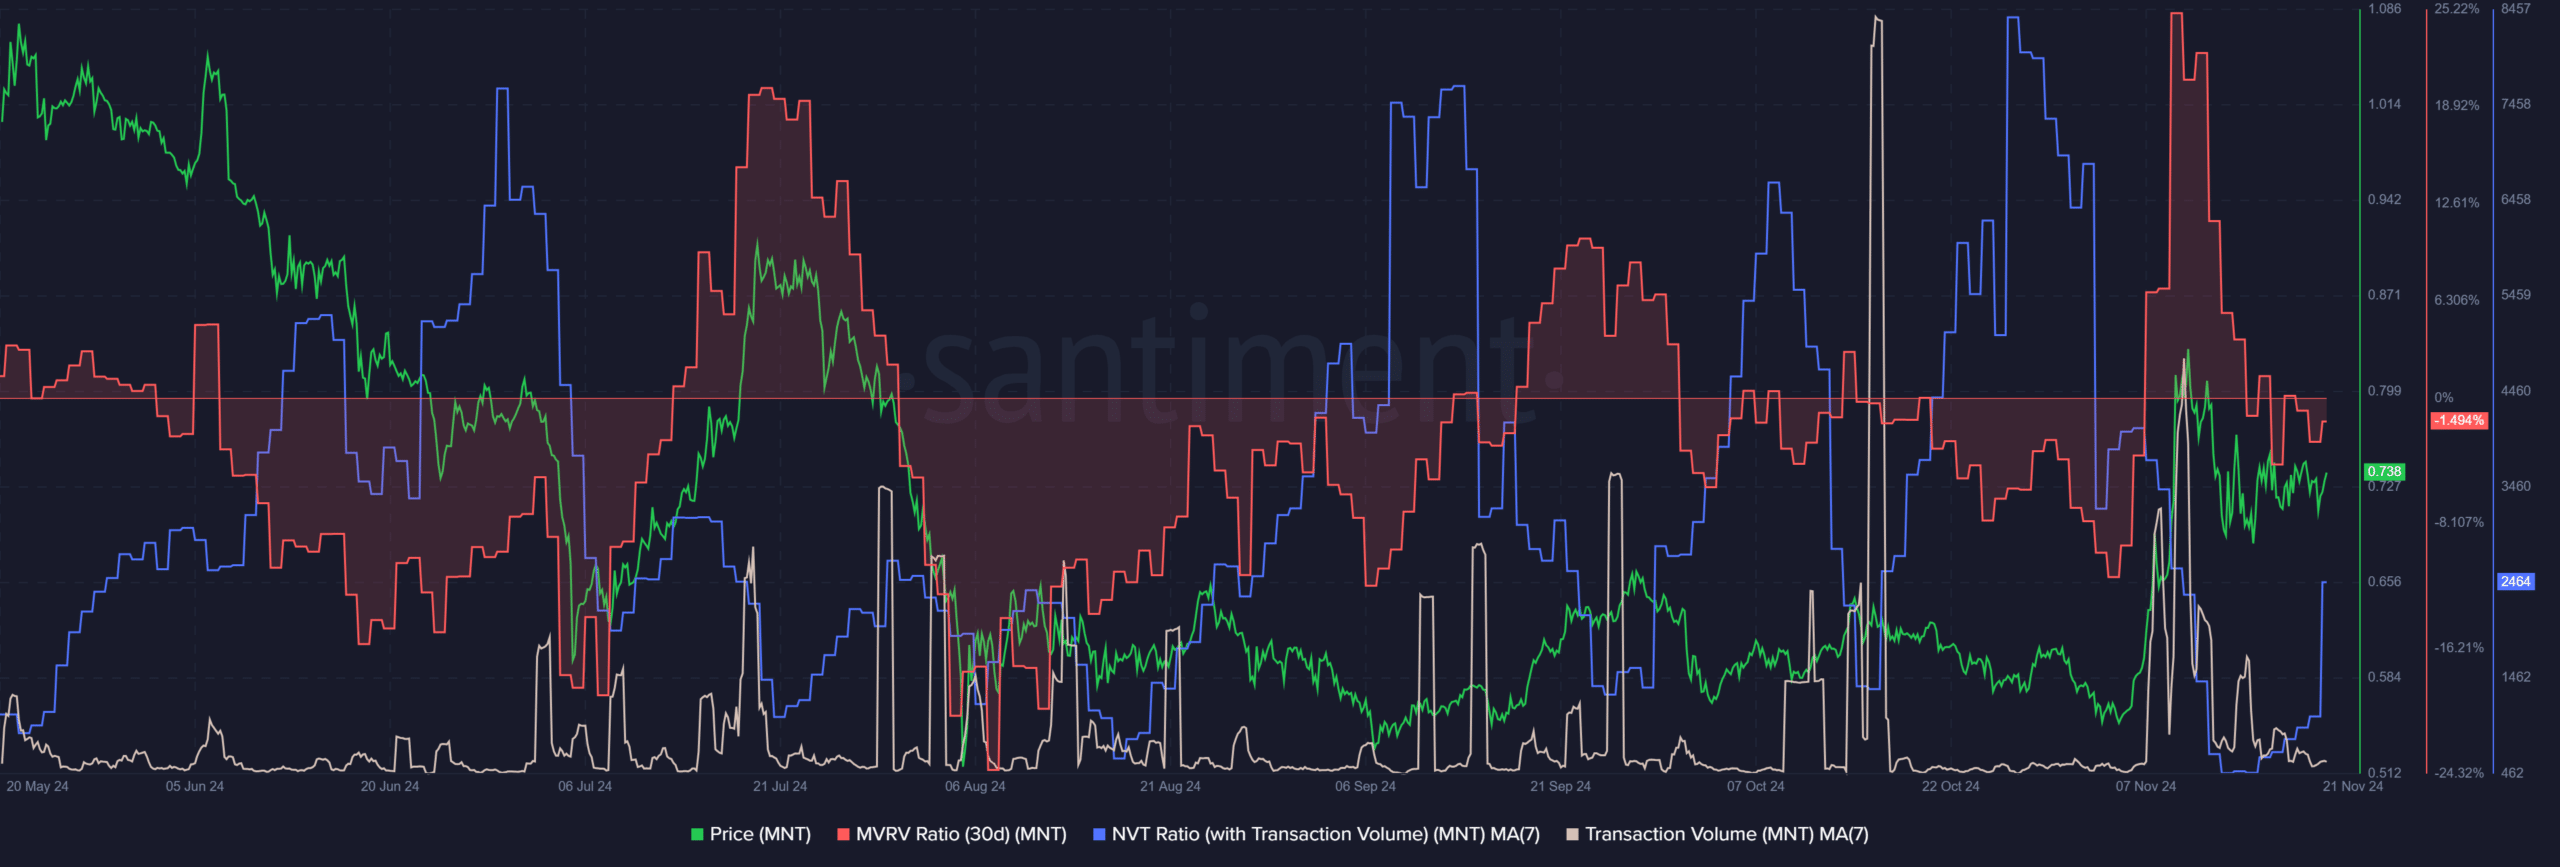
The recent retracement brought the MNT 30-day MVRV ratio to -1.4%, showing that short-term holders were at a loss on average. The price movement also brought the Network Value to Transactions (NVT) ratio lower.
This NVT trend began to change over the past three days as the transaction activity continued to plunge due to reduced network activity. Therefore, the NVT ratio began to trend higher, showing that the asset could be becoming overvalued compared to the transferred on-chain volume.
Mantle still below the mid-range resistance
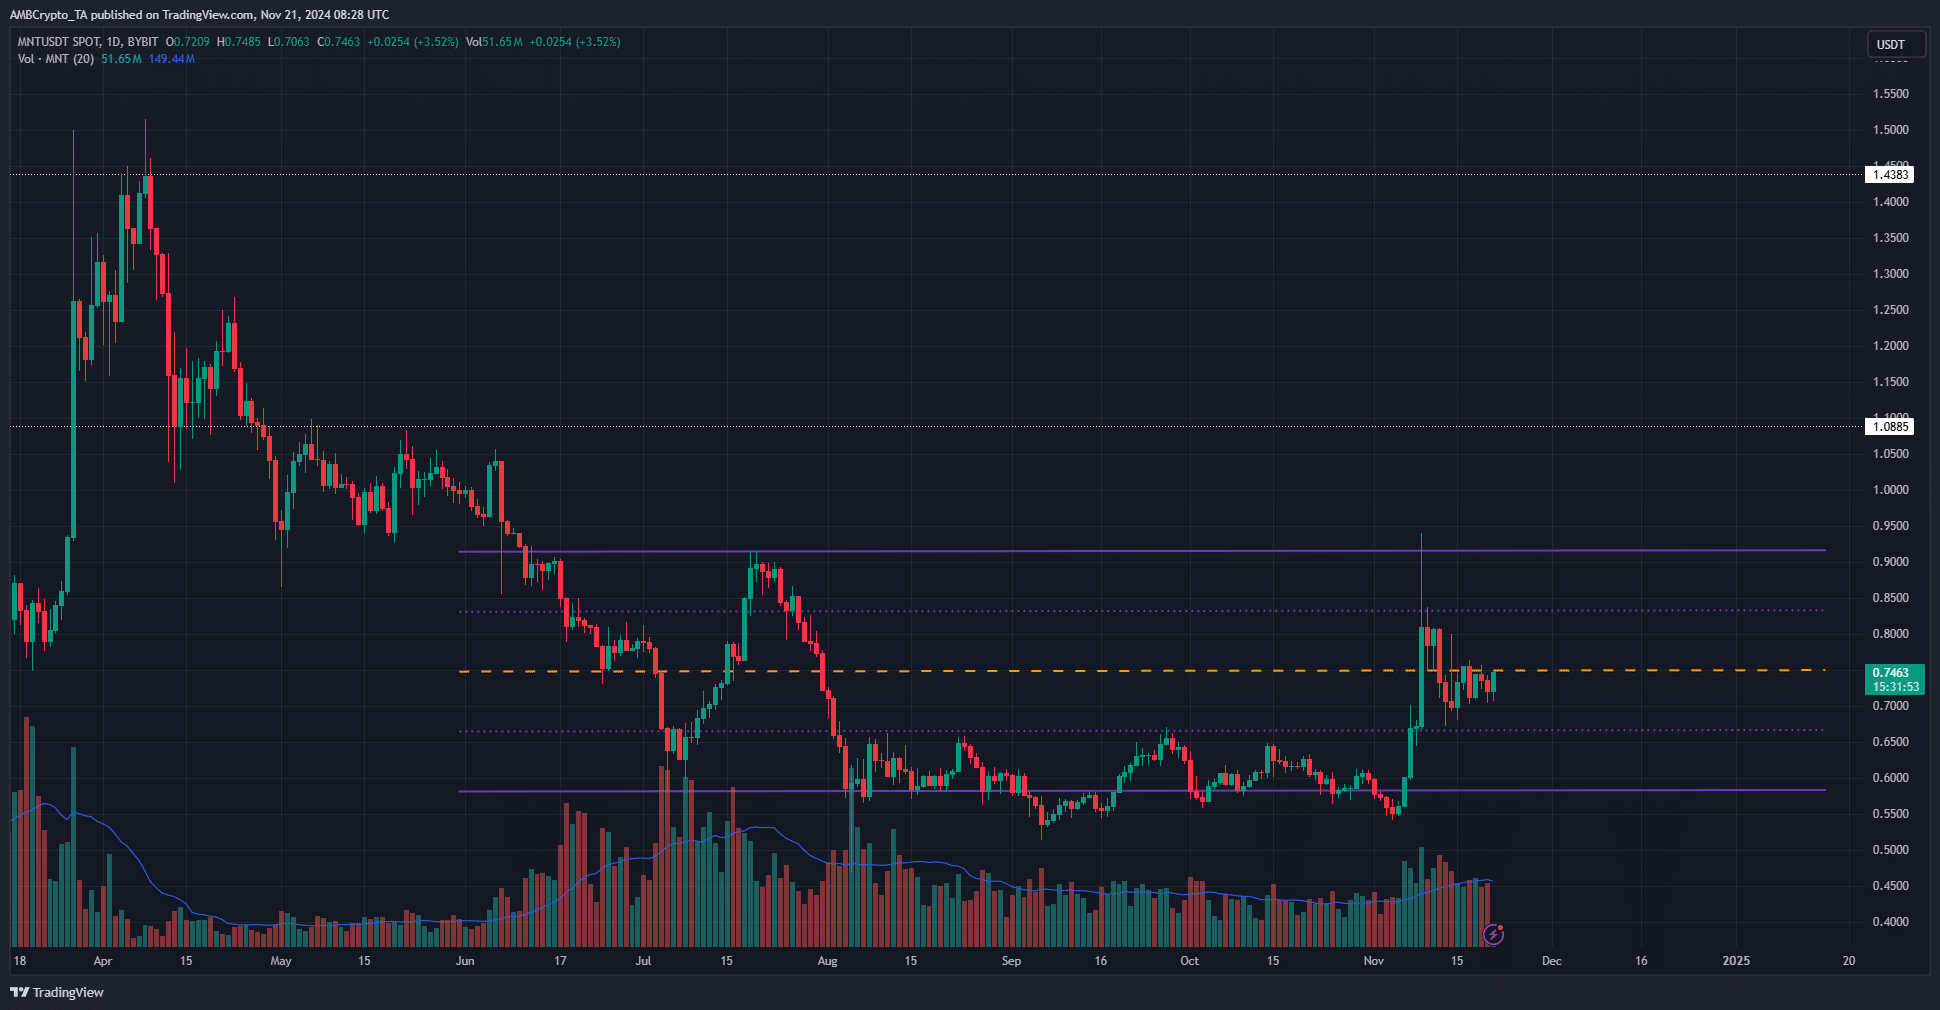
Technical analysis showed that Mantle offered a decent buying opportunity. It has traded within a range from $0.58 to $0.91 since June, and at press time was just beneath the mid-range level at $0.75.
Read Mantle’s [MNT] Price Prediction 2024-25
The 0.25 range level at $0.668 is a strong support zone, technically and historically. Hence, bulls would have the advantage so long as prices are above this level.
Rising demand for the token can spur a move beyond the range highs and toward $1.1 and $1.45.


