Toncoin inflows surge by 37%: Can TON break THIS resistance level now?
TON was experiencing strong selling pressure as total inflow to exchanges surged by 37.54% in 24 hours.

- Toncoin’s total inflow into exchanges has surged by 37.54% over the past day
- Ton hiked by 1.83% on the daily price charts.
Over the past weeks, Toncoin [TON] has been stuck between the $5.1 and $5.5 range. While most altcoins have made recent highs as they continue to enjoy Bitcoin’s momentum, TON has made moderate gains.
In fact, at the time of writing, Toncoin was trading at $5.55. This marked a 1.83% rise over the past day. Also, the altcoin has gained on weekly and monthly charts, hiking by 4.91% and 6.85% respectively.
Despite the recent gains, TON remained approximately 32.84% below its ATH of $8.24. Therefore, although the altcoin has recorded some gains on price charts, the overall market sentiment remains bearish.
What do TON’s charts suggest?
According to AMBCrypto’s analysis, Toncoin was experiencing strong selling pressure amidst bearish sentiment in a bull market.
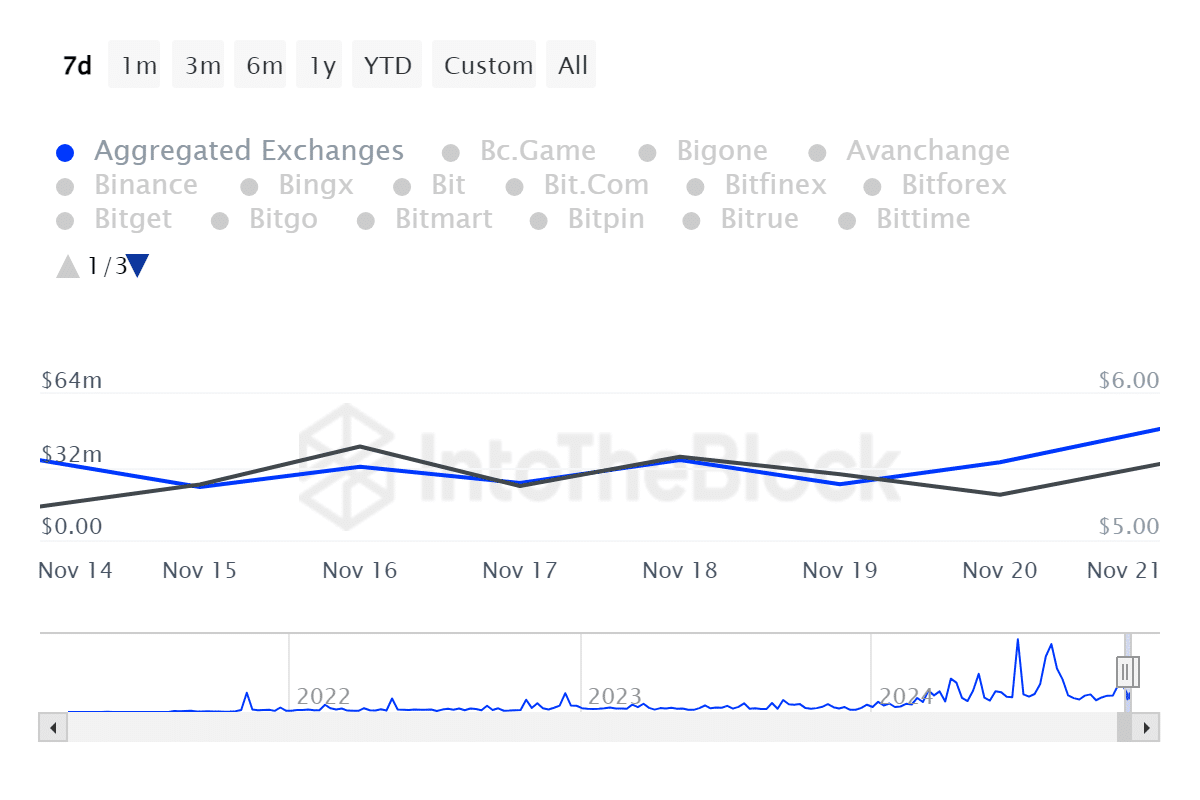
This selling pressure is evidenced by the rising inflow into exchanges. According to IntoTheBlock data, inflow into exchanges has surged by 37.54% over the past 24 hours. This has risen from a low of $34.05 million to $48.69 million over this period.
When inflow into exchanges surges, it reflects investors’ lack of confidence, thus they transfer their assets to sell to maximize profits or reduce losses.
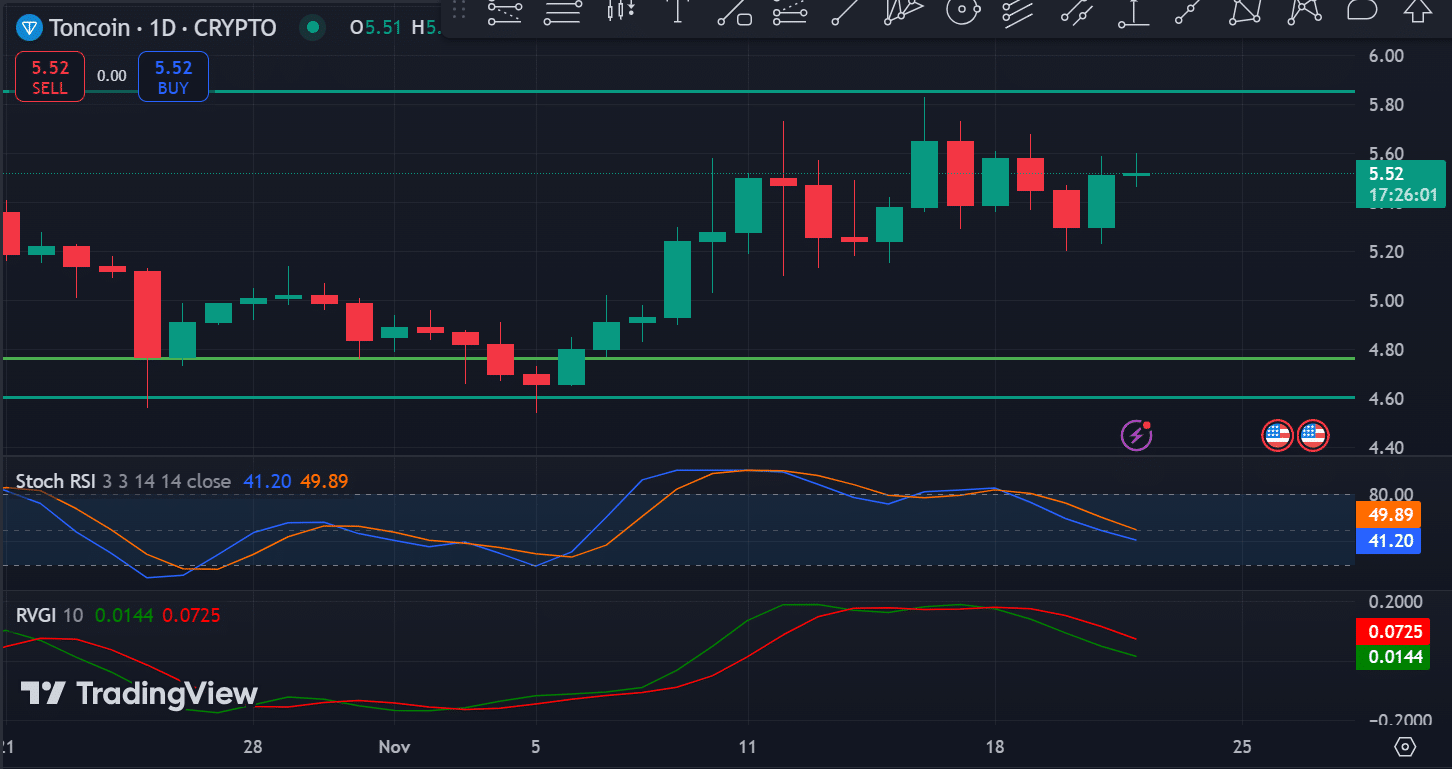
Additionally, Toncoin’s Stoch RSI made a bearish crossover days ago, signaling that sellers are dominating the market. This has dropped from 85 to 39 during this period.
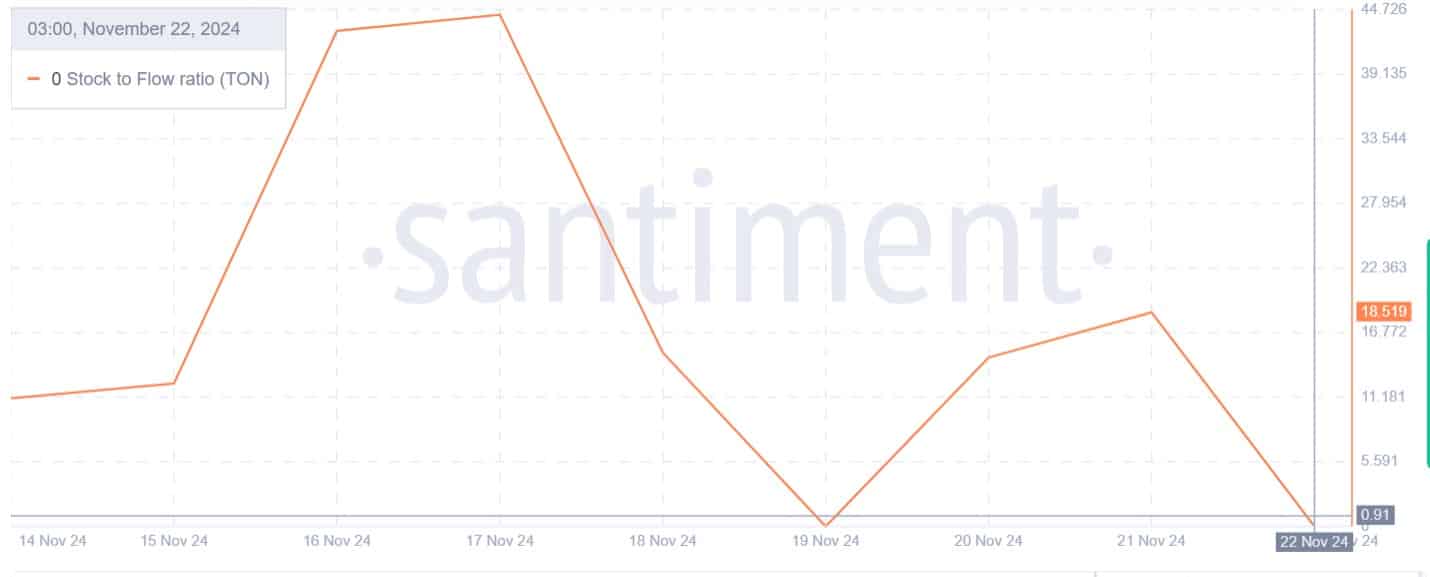
Looking further, Toncoin’s Stock-to-Flow (SFR) ratio has declined from 44.28 to 0 over the past week. Such a sharp decline in SFR suggests that the altcoin is experiencing oversupply. An increase in supply without demand often precedes price drops.
As such, if the flow rises while the stock remains constant or decreases, this oversupply results in a collapse in scarcity, which results in Toncoin’s perceived value dropping significantly.
What next for the altcoin?
Although TON has gained on its price charts, the long-legged doji indicates buyer indecision. A daily candlestick closing with a long-legged doji pointed out that both sellers and buyers were trying to dominate the market.
However, the market is skewed towards sellers, as evidenced by the Relative Vigor Index (RVGI) bearish crossover four days ago.
Is your portfolio green? Check out the TON Profit Calculator
If these bearish sentiments hold, TON could drop to $5.2, where there’s strong support. Conversely, if buyers’ recent attempts pay off, the altcoin will break out of the consolidation range and reach $6.6, where there’s significant resistance.