Hedera [HBAR] rallies 37% in a week, but signs point to $0.14 drop
![Hedera [HBAR] rallies 37% in a week, but signs point to $0.14 drop](https://ambcrypto.com/wp-content/uploads/2024/12/HBAR-awaits-a-correction-1200x686.webp)
- The token’s fear and greed index flashed a sell signal.
- A price correction could push HBAR don to $0.14 again.
Hedera [HBAR] has been on its top game over the last week, catching investors off guard. However, such massive price rises are often followed by corrections. Will HBAR have a similar fate on this occasion?
Hedera’s meteoric rise
HBAR investors must be celebrating last week, as CoinMarketCap’s data revealed that the token’s price surged by 38% during that period.
The bullish trend continued in the past 24 hours because the token witnessed another nearly 24% hike. With this, the token’s price reached $0.205 with a market capitalization of over $7.8 billion.
As Hedera’s value increased, its social metrics also increased — a signal of rising popularity of the token in the crypto space.
In the meantime, Crypto Tony, a popular crypto analyst, pointed out that this price hike opened a good entry spot for investors. But is it actually the case?
Why HBAR’s price might drop
Though the meteoric price hike favored investors, such incidents are frequently followed by price corrections.
Once the hype settles, the token might witness a slight pullback, which would rather be a better opportunity for inventors to open new positions.
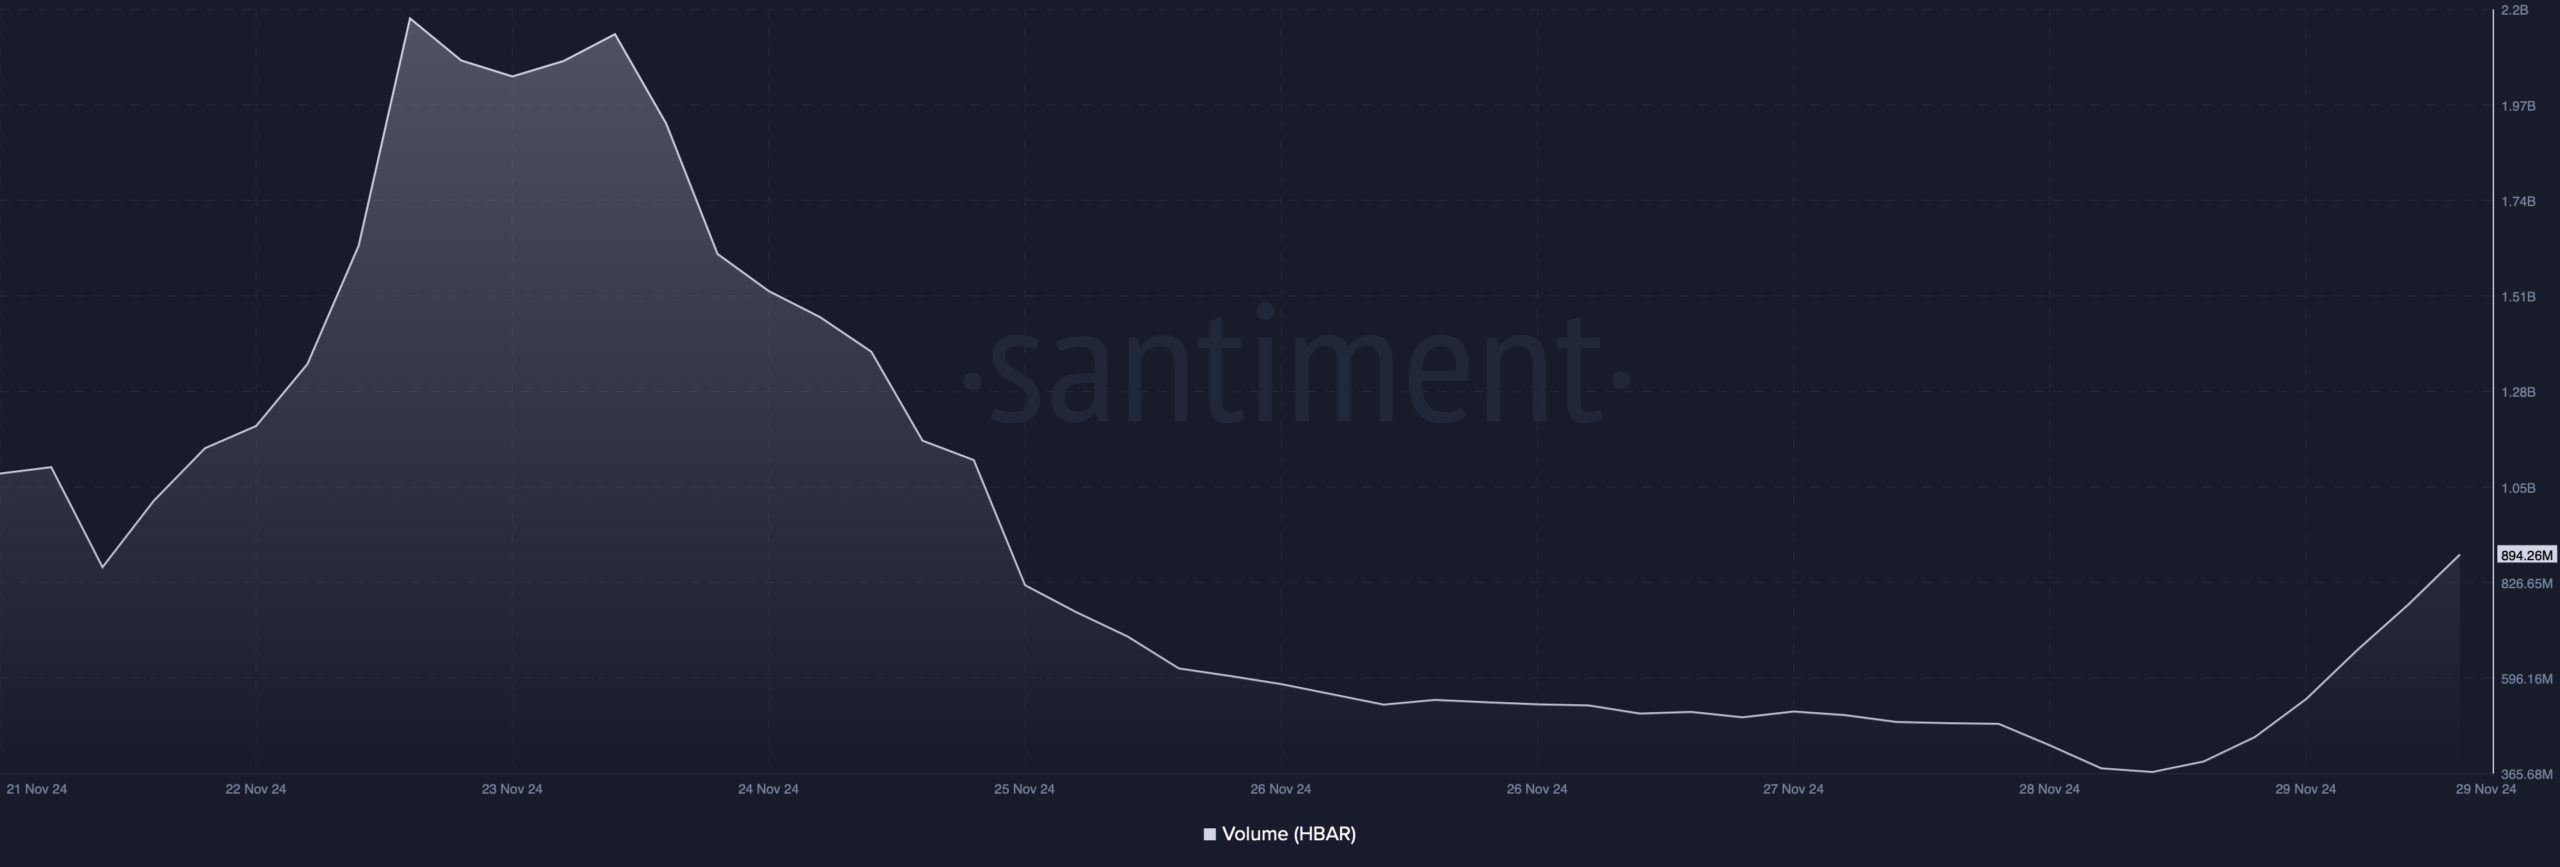
This possibility was supported by the token’s dropping trading volume. As per Santiment’s data, HBAR’s volume declined sharply while its price soared. Whenever this happens, it hints at a bearish trend reversal.
Apart from that, the token’s Fear and Greed Index also turned bearish. At the time of writing, the metric had a value of 86%, meaning that the market was in an “extreme greed” positions.
A number such high often flags a sell signal, which could have a negative impact on an asset’s price in the near-term.
On top of that, Hedera’s long/short ratio registered a down tick in the 4-hour timeframe.
This clearly suggested that there were more short positions in the market than long positions — a sign of increasing bearish sentiment.
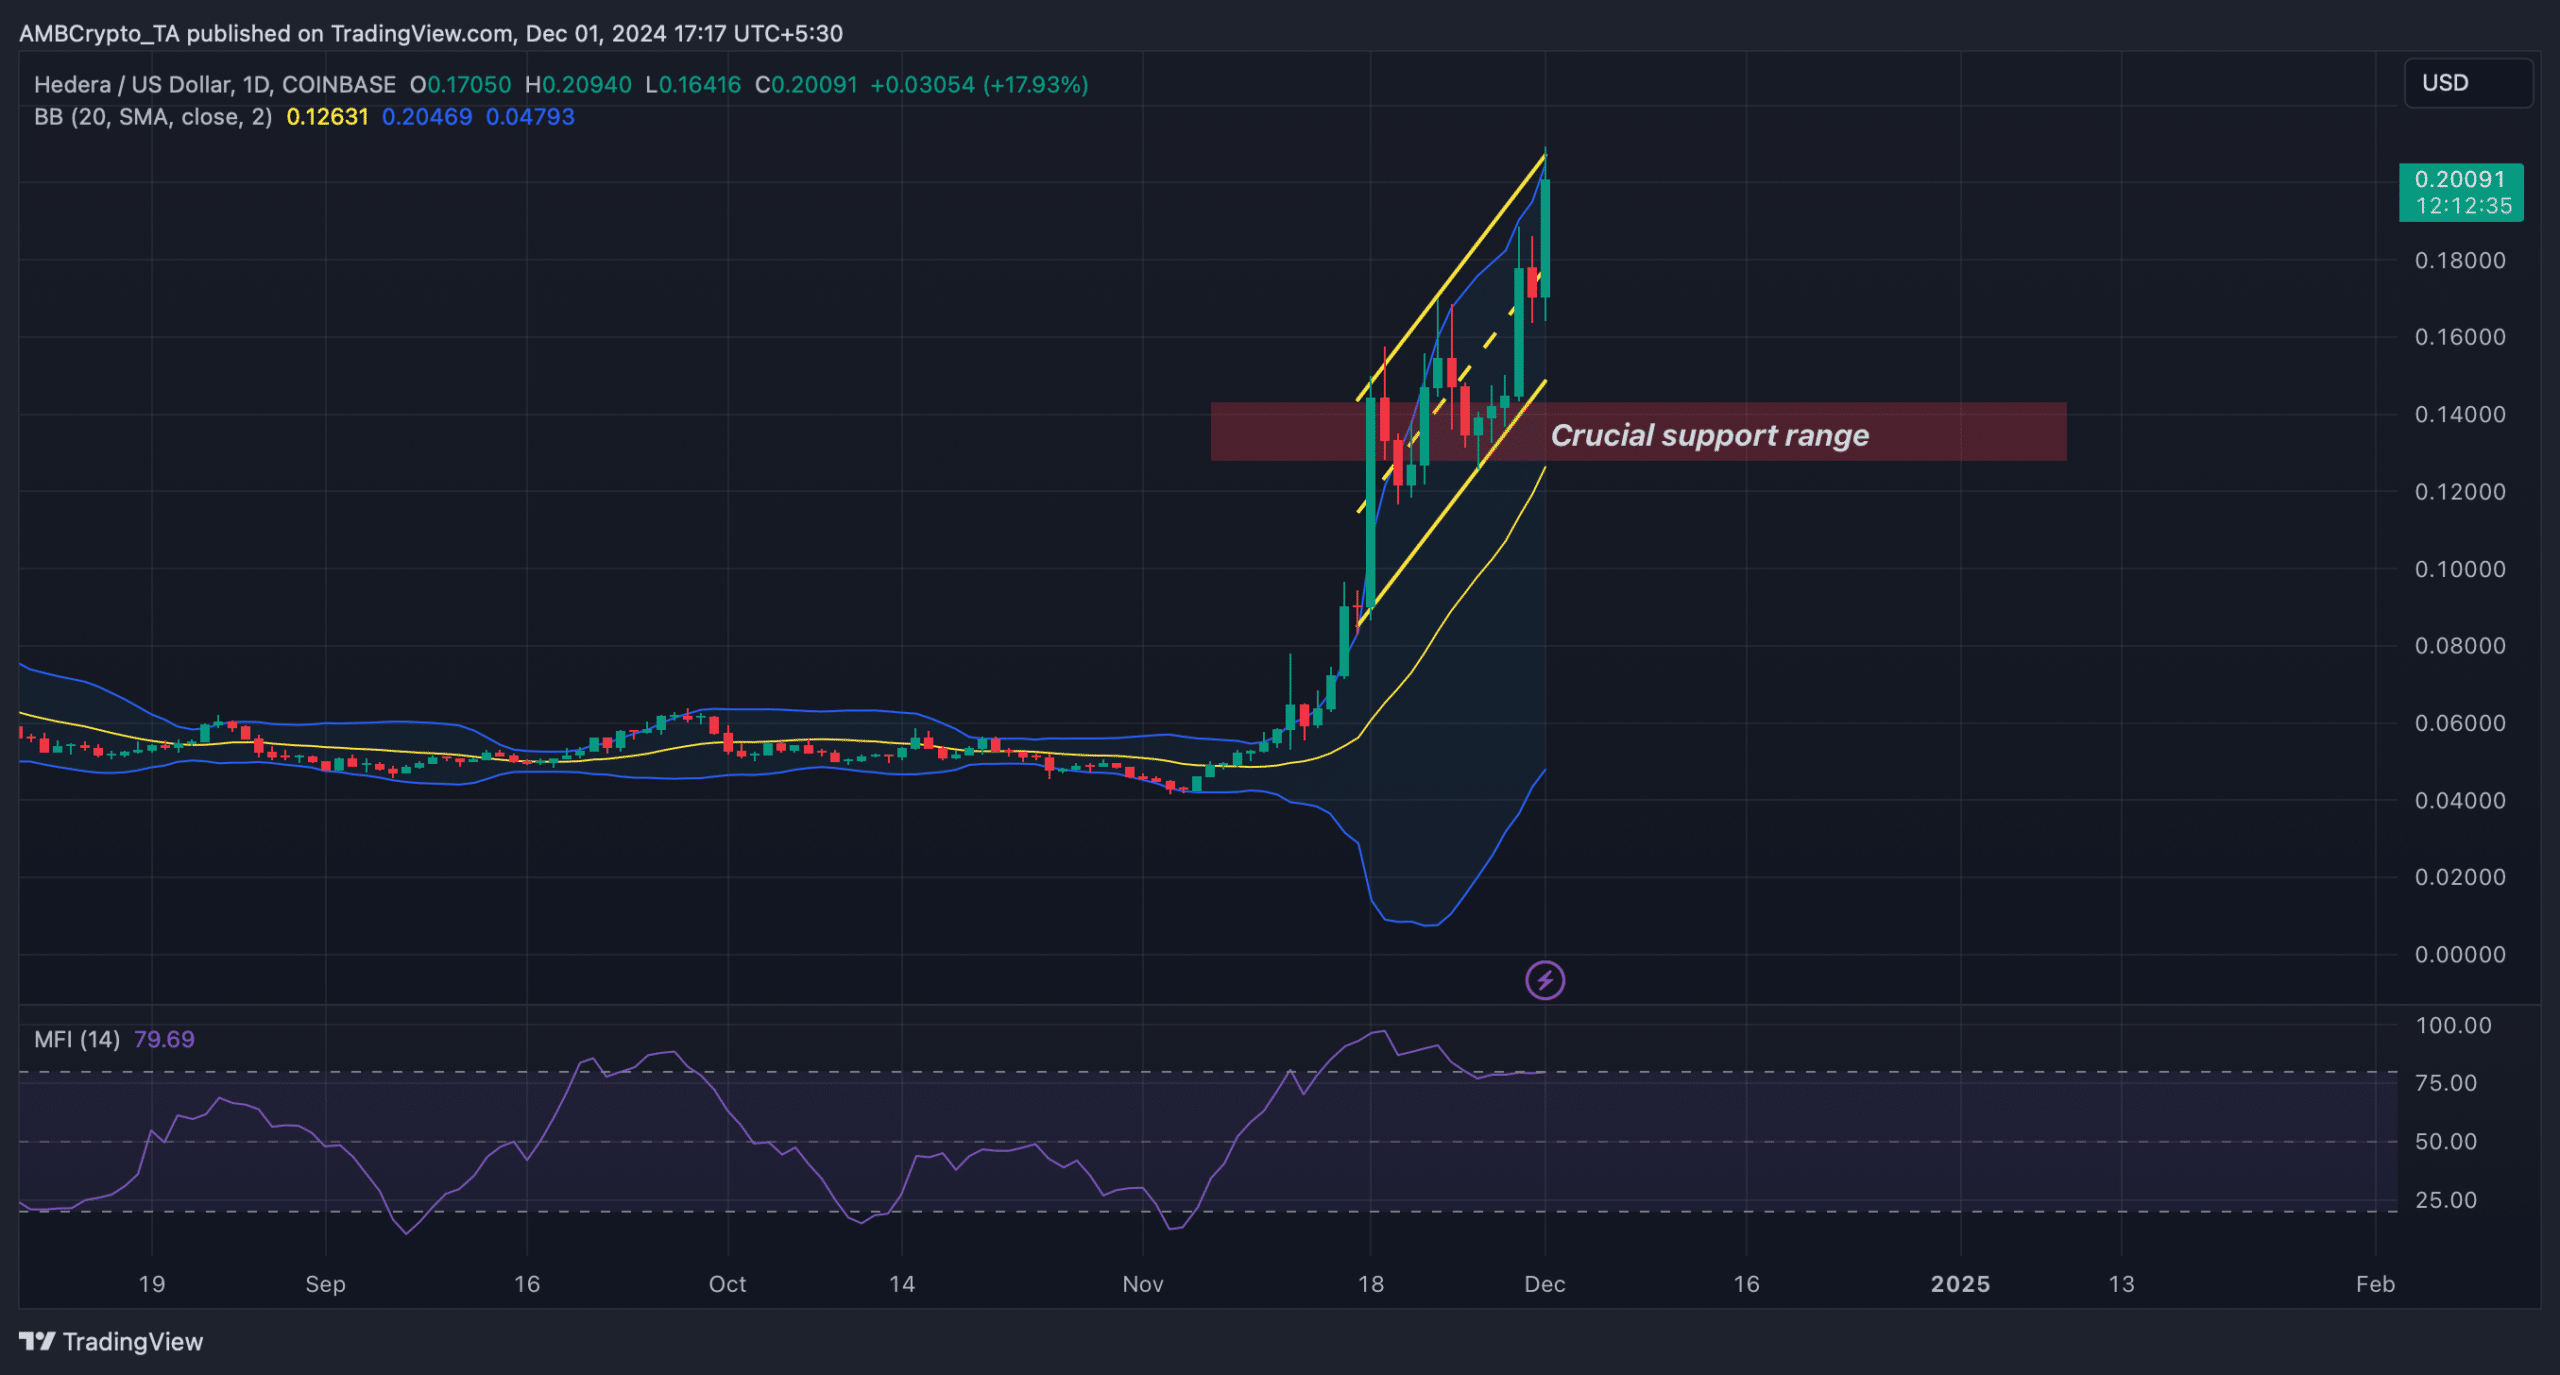
Similar possibilities of a price correction were pointed out by Hedera’s technical indicators. HBAR’s price moved inside a sharp up-channel.
This caused its price to touch the upper limit of the Bollinger Bands, which results in price corrections.
Is your portfolio green? Check out the HBAR Profit Calculator
The technical indicator Relative Strength Index (RSI) was hovering near the overbought zone. An enthery can increase selling pressure, and in turn, push its price down.
If that happens, then investors might see HBAR dropping to its crucial support range of $0.142 and $0.128.


