JASMY price prediction: Why a short-term dip to $0.03782 should be expected

- JasmyCoin has flipped the $0.0244 and $0.032 levels from resistance to support.
- The price and the OBV were at local highs that need to be broken to sustain the uptrend.
JasmyCoin [JASMY] has registered a 68.8% rally in the past week, and had gained 27.5% on Tuesday, the 3rd of December. The JASMY price prediction was firmly bullish as a result of the two key resistances at $0.0244 and $0.032 being broken on high trading volume.
The altcoin market has performed well compared to Bitcoin [BTC] over the past two weeks as the latter formed a range around the $96k mark.
The next resistance zone for JASMY bulls was the $0.05 psychological one. The June rally reached $0.0447- will this uptrend manage to push higher?
JASMY price prediction- 57% rally next?
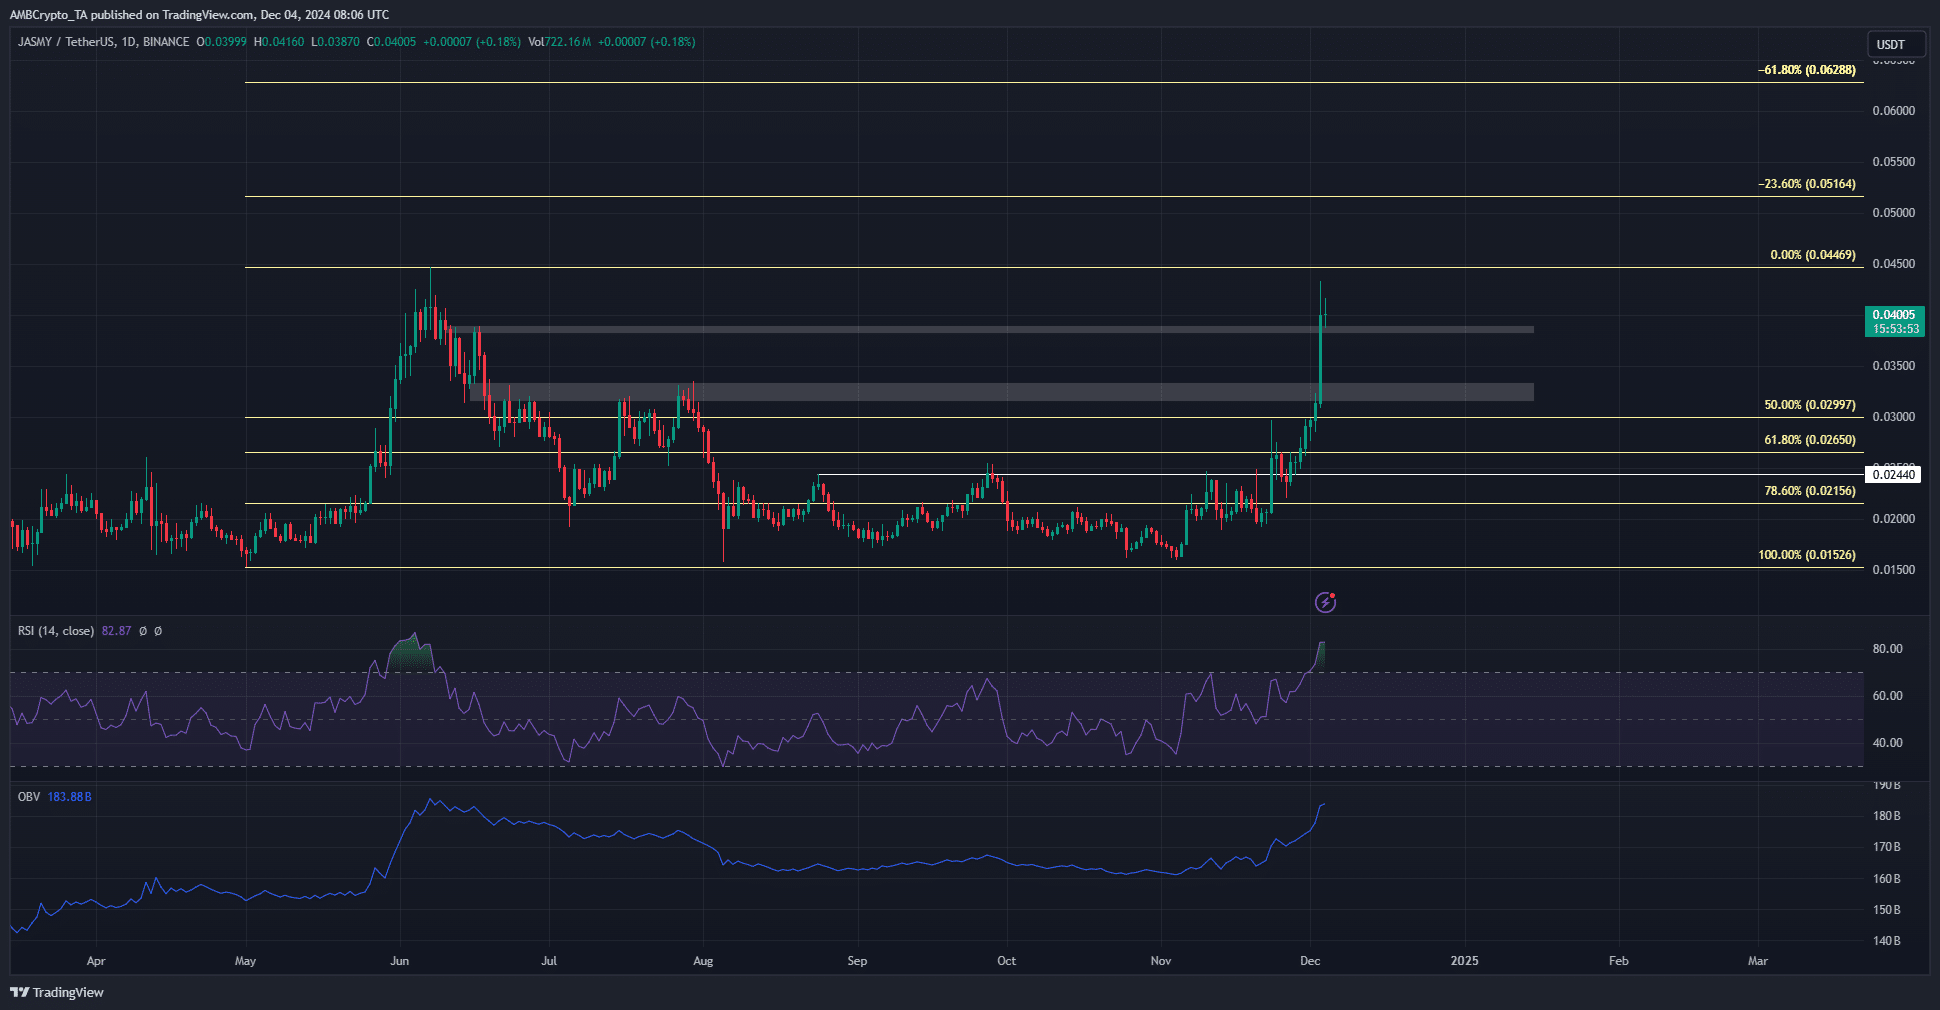
Based on the JasmyCoin rally in May and June that drove prices from $0.015 to $0.0447, a set of Fibonacci retracement levels were plotted.
In the months since then, the retracement was so severe that the 78.6% support at $0.0215 began to act as resistance in October and early November.
The $0.0244 level was broken and flipped to support toward the end of November. The OBV was trending strongly higher at that point as well. Together, these two developments were a sign of strength from JASMY bulls.
The JASMY price prediction is bullish in the long-term since the market-wide sentiment is firmly bullish. However, JASMY has its challenges.
Both the OBV and the price were near local highs. The RSI on the daily chart was at 82, showing potent bullish momentum and no bearish divergence yet.
High leverage longs likely to be hunted

Source: Coinglass
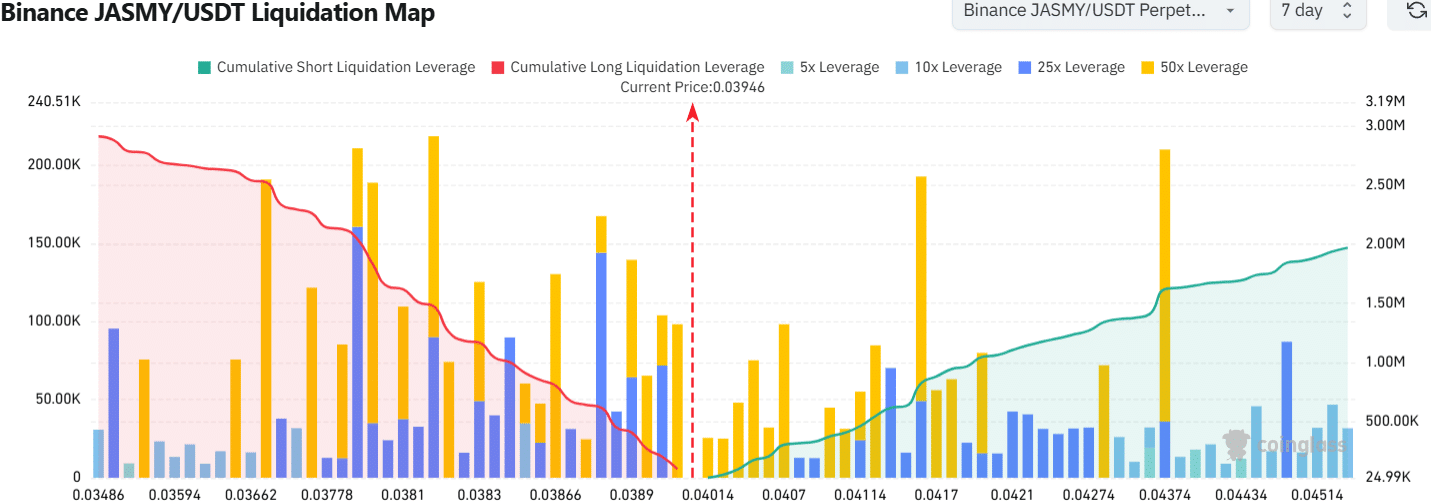
The swift price gains lead to high FOMO in the speculative markets. The $0.03782-$0.0391 area have a noticeable amount of high leverage long liquidations.
Their proximity to the price and the cumulative liquidation leverage meant that a JASMY dip to $0.03782 is likely in the coming days.
Is your portfolio green? Check the JasmyCoin Profit Calculator
The $0.0386 and $0.032 support zones would offer a buying opportunity if retested. A drop below $0.032 would be a sign that the uptrend was losing strength.
Disclaimer: The information presented does not constitute financial, investment, trading, or other types of advice and is solely the writer’s opinion


