Sui gains 500% in four months: Traders watch out for THIS key resistance

- The Ichimoku Cloud was intensely bullish on the daily timeframe.
- A price drop below $3.35, unlikely at press time, will shift the higher timeframe expectations bearishly.
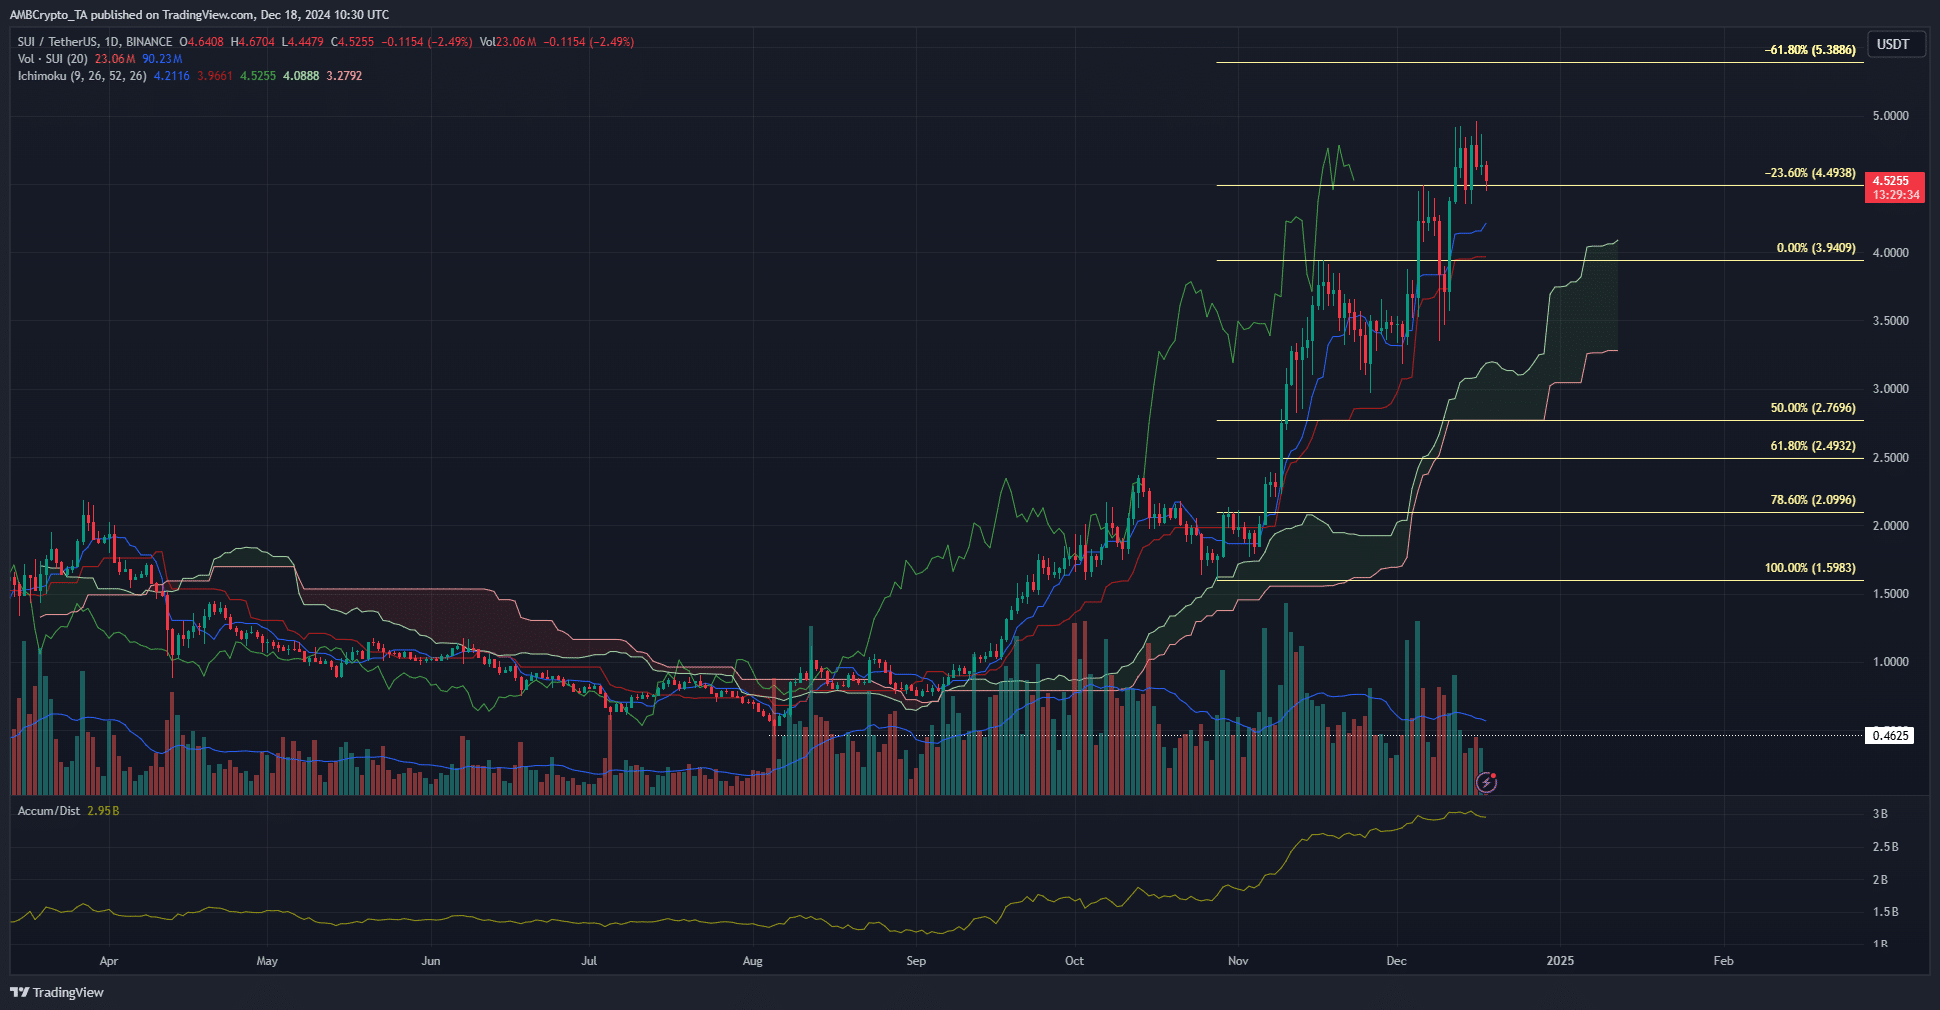
Sui Network [SUI] has a strongly bullish long-term outlook. It has performed remarkably well since September, rallying nearly 500% in under four months. Bitcoin’s [BTC] 4.8% price dip in the past 24 hours pulled Sui prices down by 8.6%.
The slight dip in buying volume in recent days gave a clue that Sui bulls could be biding their time before they’re ready to drive the next impulse move higher.
Sui projected to grow beyond the $5 mark
Sui’s price action has been strongly bullish on the daily timeframe, forming higher highs and higher lows since late October. The uptrend began in September when local resistance at $0.9-$1 was broken and retested as support.
Over the past month, the average trading volume has trended slightly downward, indicating weakened buying pressure. This is evident on the A/D indicator, which has slowed down, especially over the past week.
The Ichimoku Cloud remains bullish, highlighting strong support at $3.2 and the $4.1 region. The cloud is thick, showing strong upward momentum over the past month.
At press time, the 23.6% extension level serves as short-term support. While volatility is possible, the next target is more likely to be $5.38 than $3.5 or below.
Short-term range for SUI

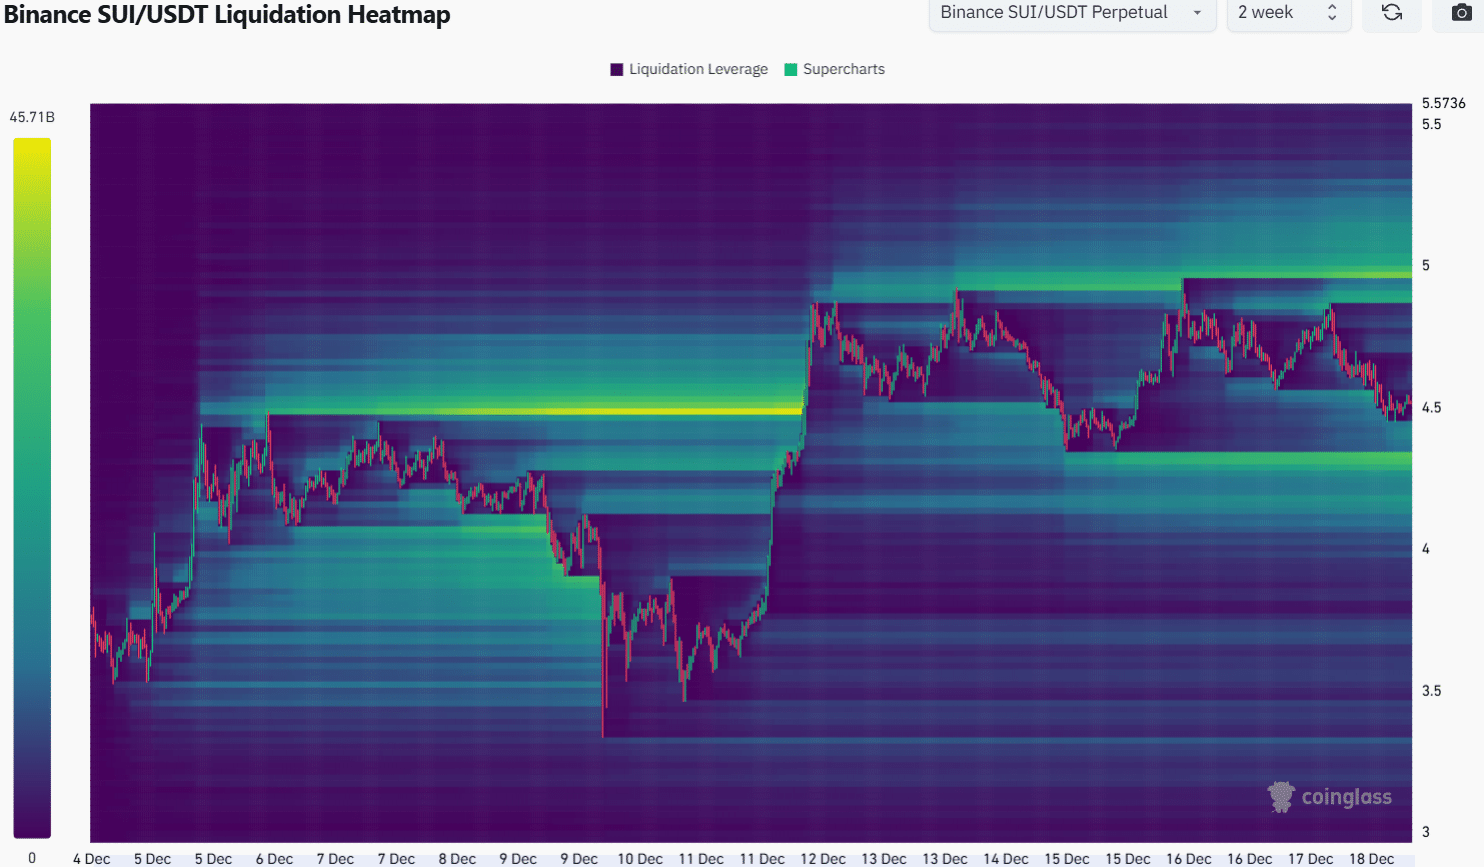
Source: Coinglass
The Fibonacci extension level at $4.5 served as resistance earlier this month and has been flipped to a demand zone. The 2-week look back period showed a cluster of liquidation levels around $4.3, and another liquidity pocket at $5.
Is your portfolio green? Check the Sui Profit Calculator
The price has also ranged between these two levels over the past week, explaining the liquidity build-up. The Bitcoin price dip and the consolidation phase for SUI meant that this range formation could continue for a few more days.
Disclaimer: The information presented does not constitute financial, investment, trading, or other types of advice and is solely the writer’s opinion


