Record low for Bitcoin’s exchange transfers – Will it push BTC’s price down?

- Most market indicators looked bearish on Bitcoin.
- In case of a trend reversal, BTC might move towards $100k again.
While Bitcoin [BTC] struggled under $96k, the coin’s exchange activity has also witnessed a massive drop. Therefore, AMBCrypto planned to investigate further to find out whether this latest development will have a continued negative impact on the king coin’s price.
Bitcoin transfers hit a record low!
Woominkyu, an analyst and author at CryptoQuant, recently posted an analysis highlighting a notable development. As per the analysis, BTC’s exchange-to-exchange transactions have dropped significantly.
The analysis mentioned, “The notable spikes in transaction volume align with significant price changes. In particular, the peaks in exchange transactions marked in the red circles precede or coincide with sharp price movements.
The first highlighted peak in 2017 corresponds with Bitcoin’s historical price surge, while the second peak around 2021 matches another significant price movement.”
Recently, the transaction volume has decreased significantly, indicating lower trading activity compared to previous years.
Where is BTC headed?
Will this decline in exchange-to-exchange transactions harm the coin’s price in the near term? Let’s find out.
According to our analysis of CryptoQuant’s data, Bitcoin’s net deposits on exchanges were lower compared to the last seven days’ average, hinting at a rise in selling pressure. The coin’s aSORP was also red, indicating that more investors were selling at a profit. In the middle of a bull market, this can suggest a market top.
BTC’s Binary CDD pointed out that long-term holders’ movement in the last seven days was higher than the average. If these movements were for selling, it may have a negative impact.
However, Glassnode’s data revealed a different story. The platform’s accumulation trend score indicator showed a value of over 0.93 at press time.
A value closer to one indicates high buying pressure on BTC, which is a positive signal, as high buying activity typically results in price hikes.
Nonetheless, Coinglass’s data pointed out another bearish metric. BTC’s Long/Short Ratio registered a sharp decline in the 4-hour timeframe.
This meant that there were more short positions in the market than long positions, which could push the coin’s price down in the short term. If the price decline continues, BTC might drop to $91k.
Read Bitcoin’s [BTC] Price Prediction 2024–2025
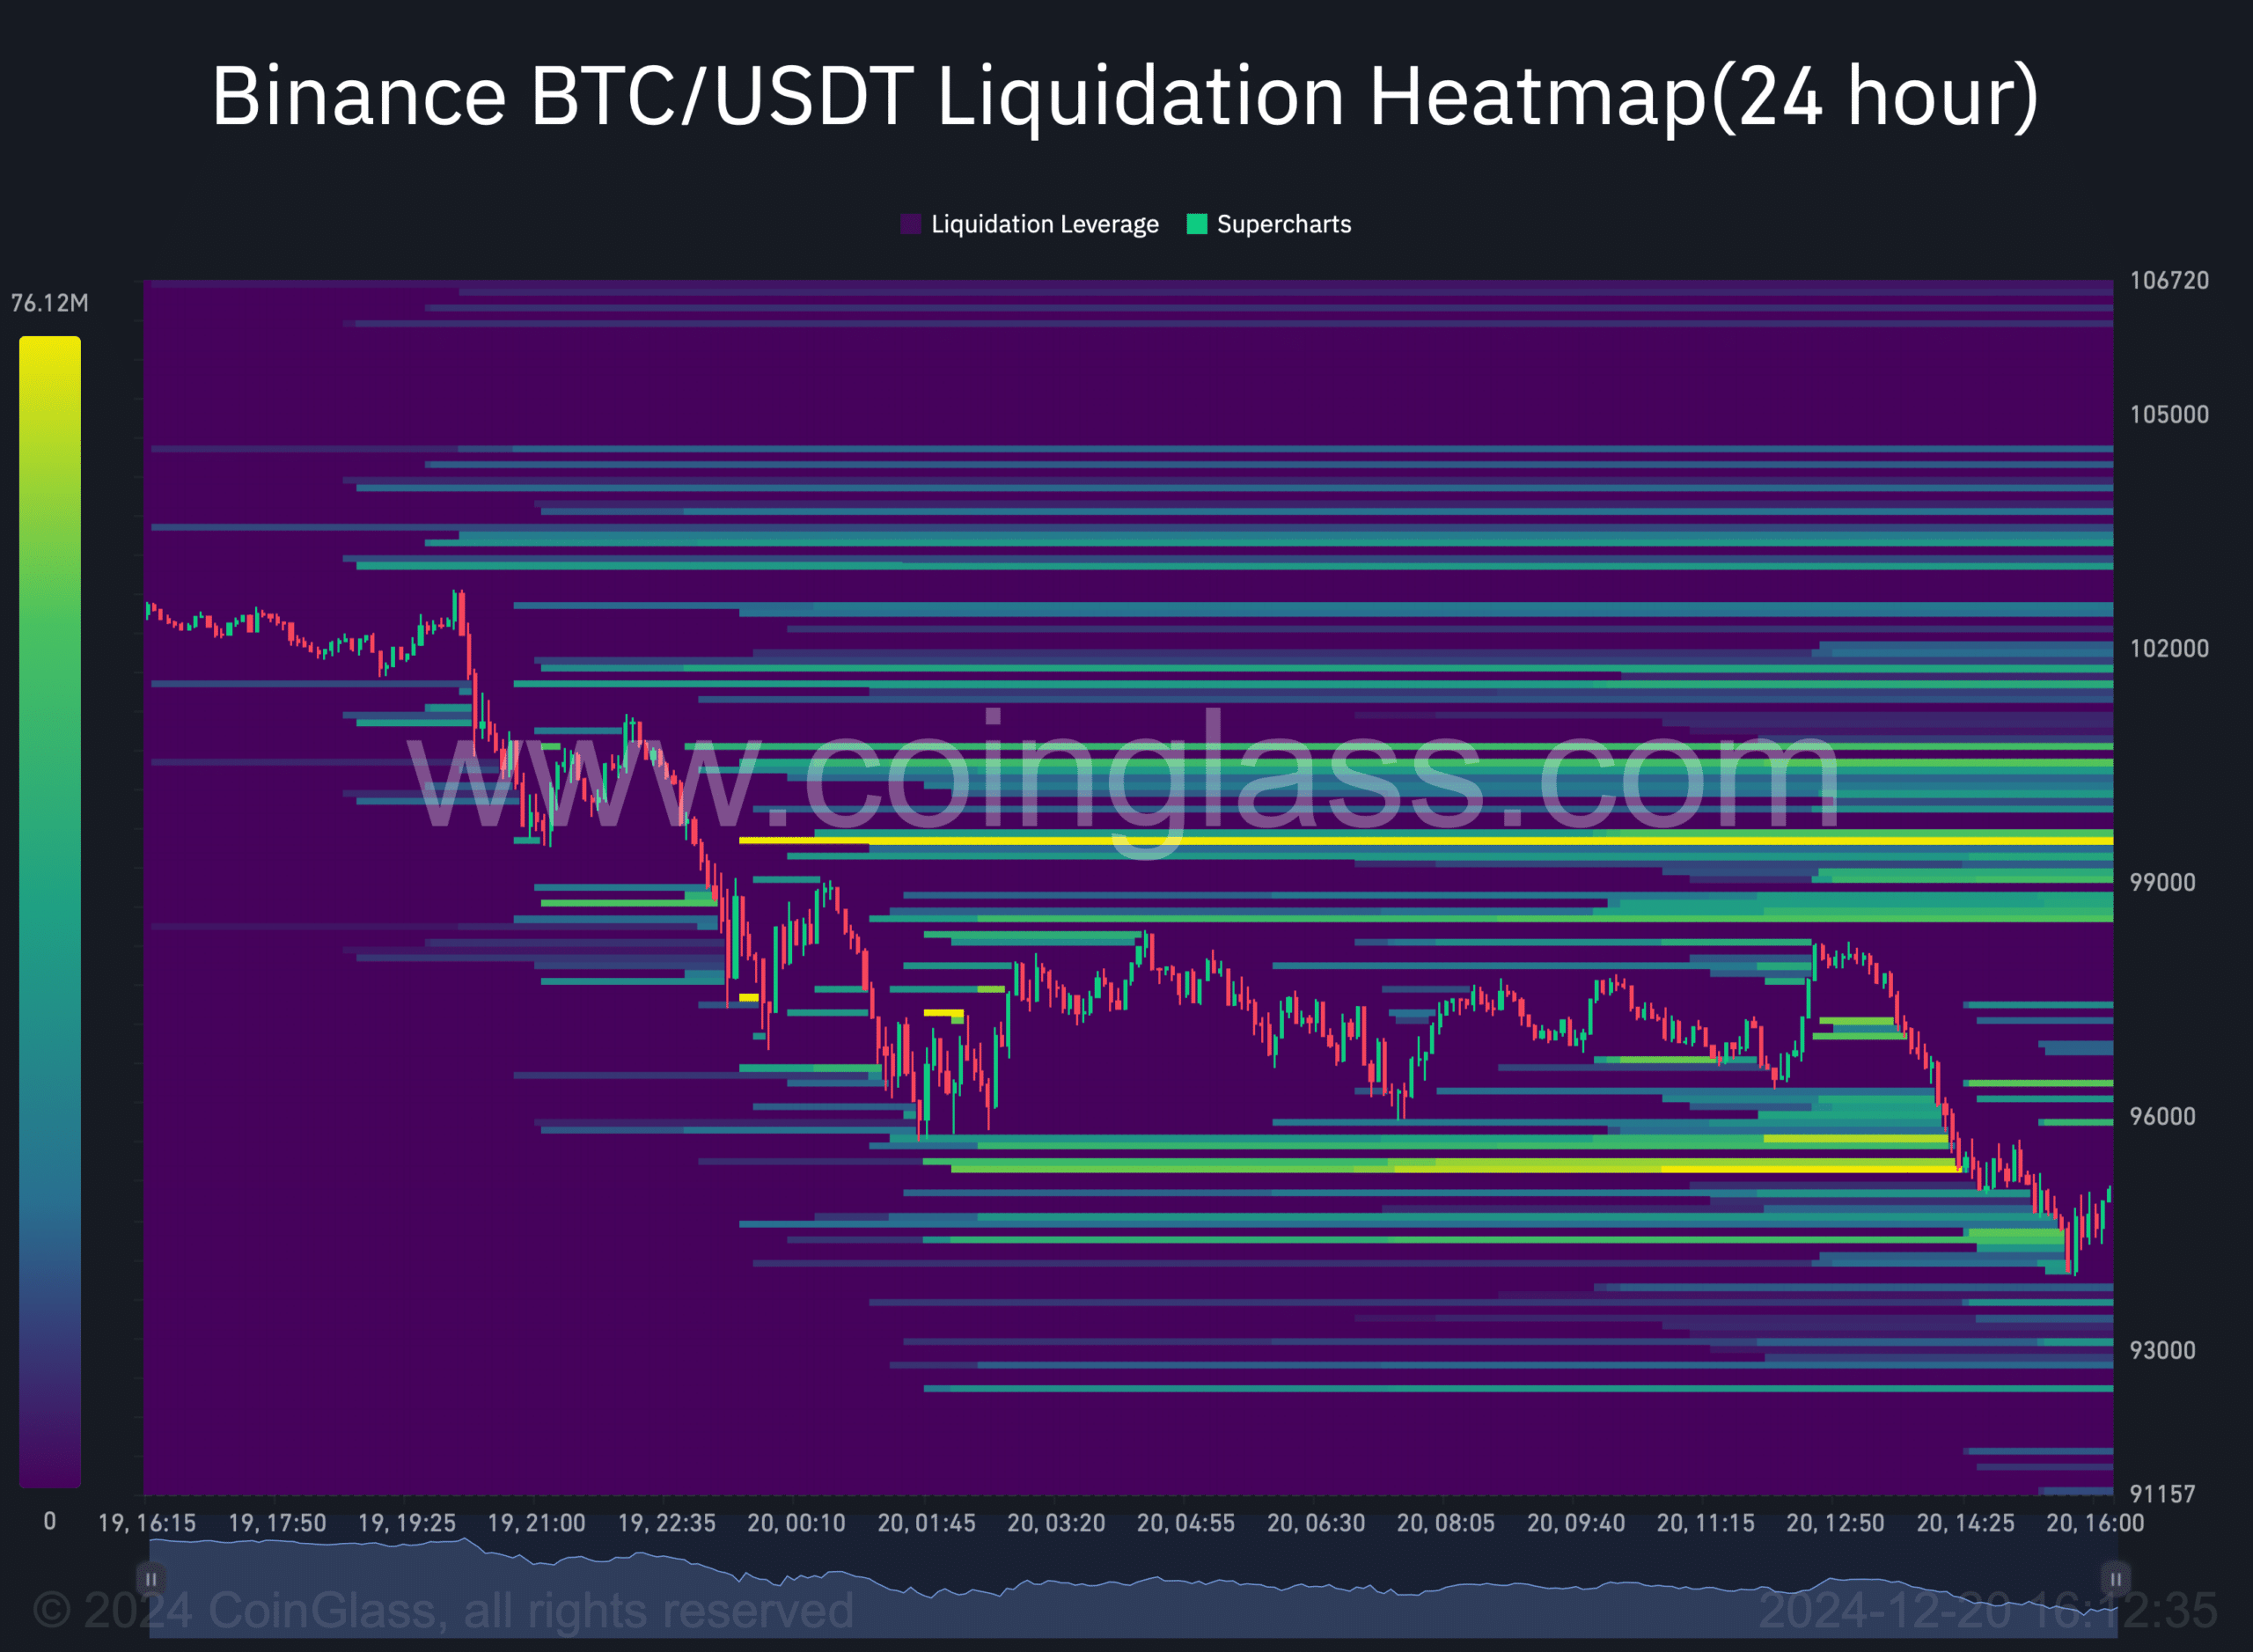
However, if the bulls initiate a trend reversal, BTC could potentially retouch the $99.5k-$100k mark, as suggested by the king coin’s liquidation heatmap.


