All about LUNC’s 394B token burn and how THIS level could be key

- LUNC burns 19.67M tokens daily, reaching 394B burned to support recovery and reduce 5.5T supply.
- LUNC price stabilizes near $0.00011 amid declining market activity, cautious trading, and mixed momentum.
Terra Luna Classic [LUNC] ecosystem continues its aggressive token burn strategy, recording a total daily burn of 19,674,564 tokens on December 22, 2024.
According to data from LUNC Burn Tracker, this consists of 7,265,976 tokens burned by wallets and an additional 12,408,588 tokens burned through on-chain mechanisms.
LUNC has burned over 394 billion tokens, reducing its supply from circulation’s massive 5.5 trillion tokens.
This burn initiative is crucial for Terra Luna Classic’s recovery plan. It aims to support price stability and future growth.
Price stabilizes amid market volatility
LUNC’s price increased by 1.82% over the past 24 hours, trading at $0.0001123 with a 24-hour volume of $37.21 million.
However, the token has faced pressure, recording a 12.31% decline over the past seven days. Its market cap is valued at approximately $618.43 million.
In the past 24 hours, LUNC’s price fluctuated between $0.0001054 and $0.0001135. The broader 7-day range stretched from $0.00009174 to $0.0001344.
LUNC is attempting to stabilize near the $0.0001100 support level, with immediate resistance observed around $0.0001200.
Technical indicators show mixed momentum
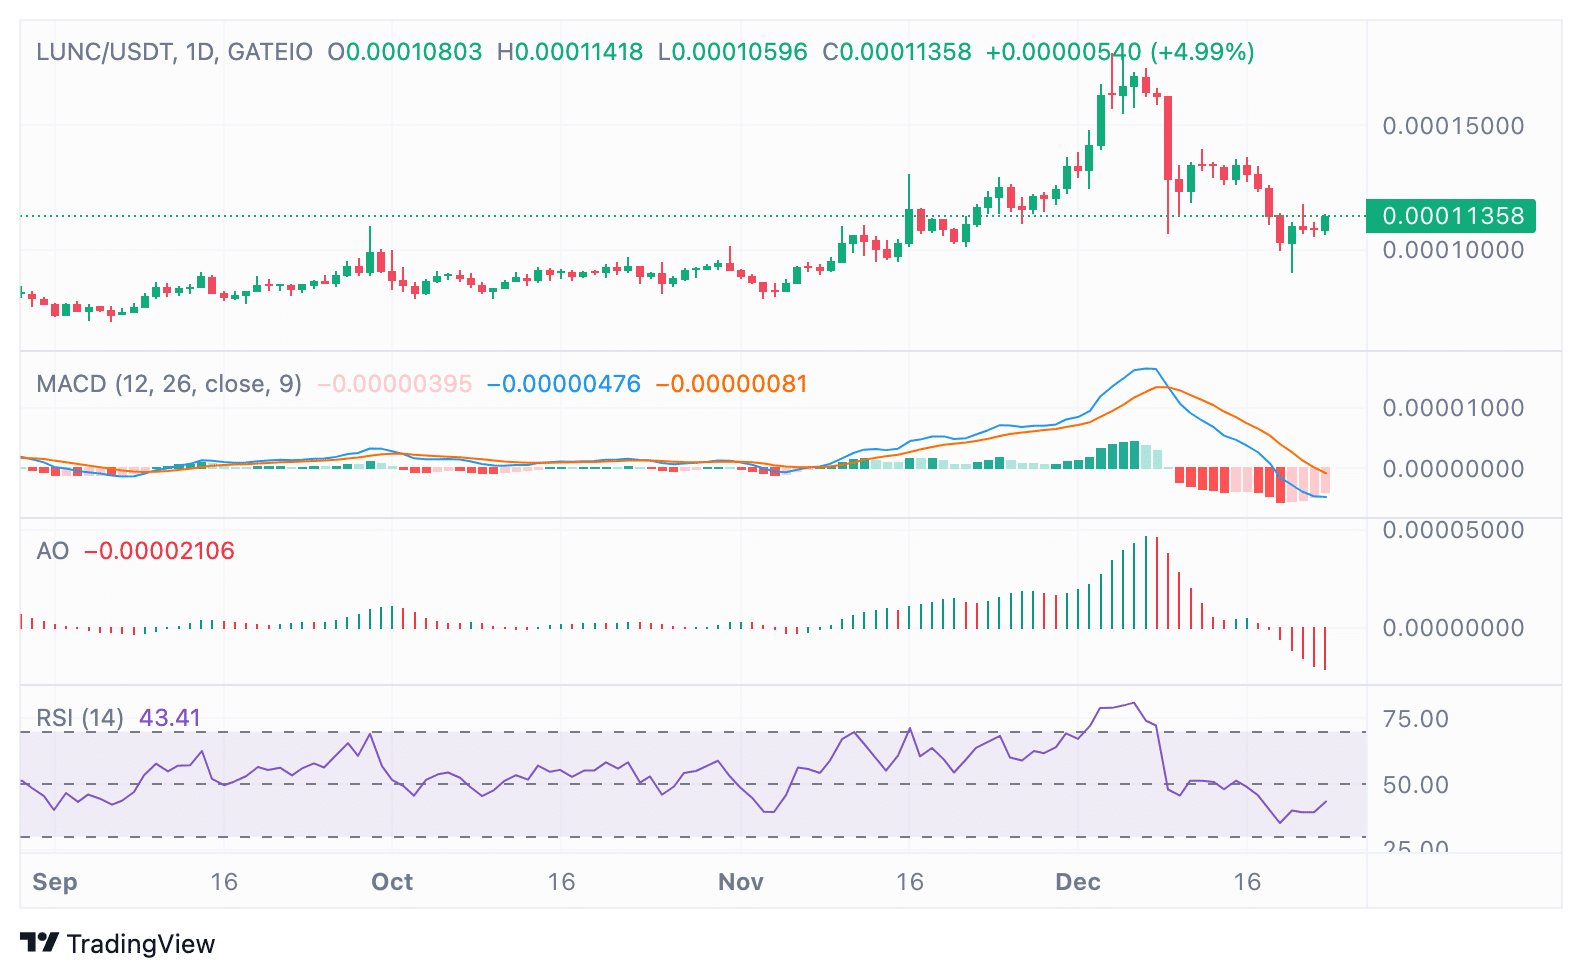
Technical indicators on the LUNC/USDT daily chart suggest mixed momentum. The Moving Average Convergence Divergence (MACD) displayed a bearish crossover, though fading red histogram bars indicate weakening bearish pressure.
Similarly, the Awesome Oscillator (AO) reflected diminishing selling pressure, hinting at the possibility of a reversal if the indicators move above their neutral zones.
The Relative Strength Index (RSI) stood at 43.41, recovering from oversold territory.
A sustained move above the 50-level could indicate further bullish momentum, while key levels to watch remain at $0.0001000 for the downside and $0.0001200–$0.0001250 for upside confirmation.
Derivatives and liquidation data indicate cautious sentiment
LUNC derivatives data reveals reduced activity, with trading volume down 15.35% and open interest falling by 4.57%. Despite the decline, the 24-hour long/short ratio is 1.0255, slightly favoring long positions.
Notably, OKX traders exhibited stronger bullish sentiment, with a long/short ratio of 1.26.
Liquidation data shows that $12.63K in long positions were liquidated compared to just $1.27K in short positions. This indicates higher bullish leverage in the market.
Is your portfolio green? Check the LUNC Profit Calculator
Spikes in liquidation activity have coincided with price volatility, further emphasizing cautious sentiment among traders.


